1. Abstract
A look at the development of models determining field goal probability, and related studies of meaningful predictor variables. Logistic regression is the most common way of incorporating different predictor values, with a single example of a neural network. Distance is unfailingly the strongest predictor of success, and by an order of magnitude over any other variable. Useful environmental variables also include wind, rain, and altitude. The question of clutch kicking is discussed ad nauseum, with a general consensus of there being little effect if any, and icing the kicker similarly finds little support in most works, in some cases even contraindicated.
2. Introduction
Field goals are among football’s most easily understood concepts. The kick goes through the uprights, or it doesn't. The outcome is binary and the rules are fairly unambiguous. Yet our understanding of the likelihood of a field goal attempt being successful is less clear. Commentators discuss “field goal range” in absolute terms, as though there is a defined point beyond which all field goals will succeed, and behind which none will. Terms like “chip shot” lead some attempts to be taken for granted.
Over the years, efforts have been made to quantify these probabilities, incorporating different variables. Of special interest is the question of clutch kicking, the idea that individual kickers’ performances are subject to the vagaries of game situations, and thereafter the notion of “icing the kicker,” calling a timeout before an opponent’s field goal attempt as a form of psychological warfare against the kicker. Here we examine the existing scholarship on the matter over the past thirty years through a variety of different models.
3. Field Goals
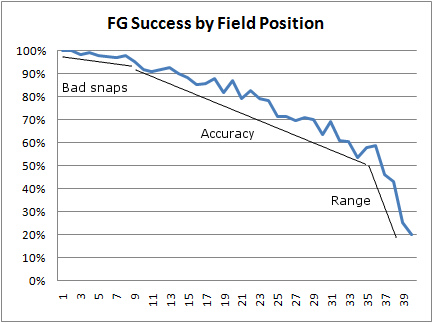
For a straightforward examination of field goal probability against field position one can look to Burke’s (2008) brief yet insightful piece. His unfiltered look at the success rates of field goals by distance in the NFL is given in Figure 1. Burke suggests a three-segment piecewise linear model of linearly declining field goal probability with respect to distance, the first being being mostly constant, with failed attempts largely the effect of bad snaps, holds, and blocks, all of which are irrespective of distance. The second region is where accuracy becomes increasingly important as the effective width of the goalposts shrinks with distance, and finally a steep decline at longer distances as kickers run out of range.
More sophisticated analysis of field goal conversion actually predates Burke’s (2008) work, perhaps out of a need to develop a model that could make better use of the limited data sets then available. Berry & Berry (1985) began their investigation of field goals with an analytical look at the effective width of the uprights given distance and hash placement. They hypothesized that accuracy was a logistically distributed property measured as an angle of deviation from the aiming point. Additional terms in the model consider the probability of blocked kicks and the effect of distance on the probability of success. By populating the model with the data from individual kickers’ recent performances through a delightfully nostalgic BASIC program the parameters for a given kicker could be determined numerically and the probability of future field goals with it. As a first foray into the field the piece provides a working model of field goals, one which has at least a prima facie sense to it, but this work is dependent on the choice of distribution, a decision which can be difficult to defend without access to more precise data on the accuracy of field goal attempts, instead of just the binary outcome. It also neglects any possible interaction effects between distance and accuracy, or distance and blocked kicks.
Morrison and Kalwani (1993) expressed doubt that NFL kickers are meaningfully different, and that any perceived differences in skill are largely an artefact of statistical clustering. Modelling kicks within a beta distribution, they used the polarization parameter as a measure of heterogeneity of kickers’ conversion rates. Their examination at first did not consider attempt distances, and while on one hand this may have served to limit the homogeneity of the distribution as better kickers would get more attempts from longer distances, one would also expect that in a given season a fair number of kickers would receive an unusually number of exceptionally difficult or easy kicks, pushing the polarization parameter in the other direction. They also looked at the distance data by binning kicks into 10-yard intervals, still to no effect. As the results stand, the largest of the polarization parameters was 0.027, and most of them were simply unmeasurably small. As a first investigation into whether kickers are unique this sends a strong opening salvo that they are largely interchangeable parts.
Instead of using a statistical distribution to model kicks, the preferred approach has been logistic regression. The history of this begins as far back as Bilder and Loughlin (1998) creating a logit model of NFL kickers. The model is extremely thorough, including parameters for a number of environmental factors, as recreated below in Table 1. Wind direction, while considered likely to be a valuable predictor, was not available and so could not be included in the analysis. Altitude proved a poor predictor, since all NFL stadia are at relatively low altitude save Denver’s Mile High Stadium (while this stadium no longer exists, it’s replacement, Broncos Stadium at Mile High, was built adjacent to its predecessor). Although a dummy variable identifying an attempt as being a PAT conversion appears to have excellent predictive value, it basically just predicts that the field goal attempt is a short one, with almost all PAT attempts at the time of this work’s publication being 20 yards. It could not be shown that a PAT was meaningfully different from a FG attempt of equal distance. Development of the model led to the inclusion of interaction terms between distance and wind, as the effect of wind is stronger as the distance of the attempt increases.
Bilder and Loughlin argue that field goal success rate is adversely affected when a successful kick would cause a lead change, and that this may imply the existence of some “clutch” factor, to which Brian Burke (2009) would certainly disagree . What seems more likely is that the authors have neglected to consider the effect of distance in clutch FG attempts. Teams trailing late in games, needing a field goal to tie or win, may find themselves forced into attempting a longer-than-usual or eve longer-than practical field goal, thereby depressing the success rate as a result of increased distance, an argument supported by Burke’s (2009) work showing “clutch” kicks to be, on average, 3 yards longer than ordinary attempts .
Variable
|
Definition
|
p-value
|
Altitude
|
Continuous variable measuring the city elevation where the placekick took place
|
.36
|
Change
|
Binary variable for lead-change placekicks versus nonlead-change placekicks
|
<.01
|
Distance
|
Continuous variable for the distance in yards of the placekick
|
<.01
|
Dome
|
Binary variable for outside placekicks versus those inside a dome
|
.23
|
Home
|
Binary variable for whether the placekick is on the placekicker’s home field or the opponent’s field
|
.49
|
PAT
|
Binary variable for whether the placekick is a PAT versus a FG
|
<.01
|
Precipitation
|
Binary variable for whether precipitation is falling (i.e. snow, rain, etc…) at game time versus no precipitation
|
.87
|
Surface
|
Binary variable for placekicks on grass versus artificial turf
|
.69
|
Temperature
|
Continuous variable for temperature at game time with dome placekicks assigned a value of 72 degrees
|
.77
|
Time
|
Continuous variable for the time remaining in the half with overtime placekicks assigned a value of 0
|
.01
|
Week
|
Assumed to be a continuous variable that ranges from the integer values of 1 to 17 denoting the week of the placekick attempt
|
.13
|
Wind
|
Binary variable for wind speed > 15 mph at game time versus ≤ 15 mph or the placekick is attempted inside a dome
|
.10
|
Brian Burke (2014a, [b] 2014) wrote two parallel pieces looking at environmental factors in the kicking game: temperature, wind speed, and altitude. Burke could find no meaningful evidence of wind speed as a factor in field goal success, suggesting that his data is insufficiently granular, as wind direction is not given, especially relative to the kick, and that teams select field goals relative to current wind conditions. This is a weaker statement than Bilder and Loughlin (1998), who themselves found high winds to be only marginally predictive (p=0.10). Burke did find a difference, shown in Figure 2, in field goal conversion related to temperature, but this effect only manifested itself at colder temperatures; field goal percentage declined when it was below freezing but was otherwise unaffected by temperatures above freezing, and only at distances beyond about 30 yards. This may explain why Bilder and Loughlin failed to find temperature to be a useful explanatory variable, as all games played in temperate-or-better conditions would be unaffected; kicker performance is affected by cold more so than heat or temperature, and that the effect is more pronounced at greater distances. These nonlinear relationships between explanatory variables serve to complicate the analysis of field goal conversion rates.

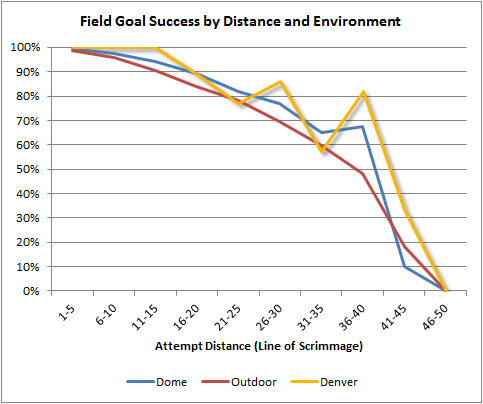
As with Bilder and Loughlin, Burke isolated Denver from all other NFL stadia. Denver’s altitude is at 5,200 feet, and the second highest is in Phoenix at 2,000 feet. As a result, Burke removed kicks from Phoenix and, building on his results regarding temperature and field goals, only considered kicks in moderate temperatures. Burke’s results in Figure 3 show that kicking in Denver is equivalent to a kick of about 5 yards less at a stadium nearer to sea level.
In their published work on kicking, Paster and Cunningham-Rhoads (2014) take us through the steps of model-building, starting with a logistic regression against only the kick distance, but progressively looking at a huge number of variables. Where this work stands out is in their effort to find additional data on the environmental factors, using a third-party site to get weather data throughout the game and estimating that each quarter is approximately 1 hour, and then considering the field direction and wind direction to separate the effect of wind into a tailwind/headwind component and a crosswind component, each direction being rounded to the nearest 22.5 degrees. To no surprise distance was the strongest predictor of performance (magnitude correlation=0.36), vastly outpacing any other. Setting this study apart was the presence of crosswind, which proved to be the second-strongest factor (magnitude correlation=0.6). The authors argue that “one of the following is true: there is substantial “random-ness” involved in field goal kicking, individual kickers vary in ability, and/or factors other than distance can (in combination) significantly affect the probability of success” (Pasteur and Cunningham-Rhoads 2014). They make a point of stating that longer field goals are going to be disproportionately attempted by the kickers best able to convert them.
A look at stadium effects is inconsistent in its ability to deliver solid p-values, with small sample sizes and varying distances impacting the work, as well as the confounding effects of local weather, which risks being double-counted in the analysis. While somewhat useful factors in the model include “total wind speed, crosswind speed, temperature, dew point, playoff, head/tailwind, dome, and number of previous kicks” (Pasteur and Cunningham-Rhoads 2014), these all failed to provide even one one-hundredth of an improvement over the simple distance model.
Another element of field goal kicking that is seriously investigated is the tradition of “icing the kicker,” calling a timeout immediately before a field goal attempt under the notion that the delay will affect the kicker’s mental state. This idea was examined in several works, most famously by the book Scorecasting (Moskowitz and Wertheim 2012), who found that, in fact, icing the kicker had quite the opposite effect. Moskowitz’s results, given in Table 2, show that the effect of icing the kicker is small, and that save for at the very end of the game is counter-productive. The slight impact of icing the kicker in the final 15 seconds of a game may have more to do with increased kick distances out of desperation, and coaches may be more inclined to ice longer kicks that shorter ones.
Field goal success whether opponent calls a timeout or not (percentage of kicks made)
| |||
Situation
|
All kicks
|
Iced kicks
|
Non-iced kicks
|
<2:00 in 4th quarter or OT
|
76.2%
|
74.2%
|
77.6%
|
<1:00 in 4th quarter or OT
|
75.5%
|
74.3%
|
76.4%
|
<0:30 in 4th quarter or OT
|
76.5%
|
76.0%
|
76.9%
|
<0:15 in 4th quarter or OT
|
76.4%
|
77.5%
|
75.4%
|
A similar look at iced kicks (Skerda 2016) between 2000 and 2015, seen in Table 3, could find no difference between kicks that were or were not iced, when looking only at high-leverage kicks. Looking at the effect of icing the kicker against all kicks did show some evidence in favour of icing the kicker, about five percentage points, but distance was not considered here, a likely key factor as iced kicks correspond with high-leverage kicks and therefore are related to longer distances. Additionally, the sample sizes between the two sets were orders of magnitude apart. This approach can only be used when each data point is settled, and the presentation of confidence intervals would make clear the issues with this approach.
When looking into iced and non-iced kicks relative to distance, seen in Figure 4, the effect of icing seems to grow with the distance of the kick attempt. However there is a methodological problem with the fitted polynomial - it fits the results of the average success rate by distance, and not every kick individually. For example, if there have been 500 field goal attempts from 32 yards, at a 90% success rate, and 5 field goal attempts from 60 yards, successful 22% of the time, they are both weighted equally in the regression. As a result, a small number of misses at extreme distances, all going into the regression as zeroes, unduly weigh down the iced kicks with their smaller sample size, as those are the high-leverage kicks taken by teams with no better options. In the ordinary course of the game teams only attempt very long field goals when they specifically feel that the conditions are in their favour - the weather, the wind, the altitude, and the individual kicker.
Kicks Good
|
Kicks No Good
|
Total Kicks
|
Success Rate
| |
Clean
|
245
|
78
|
323
|
75.9%
|
Iced
|
141
|
45
|
186
|
75.8%
|
Difference
|
104
|
33
|
137
|
0.1%
|

A short piece in CHANCE (S. M. Berry and Wood 2004) found evidence on behalf of icing the kicker within their piecewise logistic regression model, but while they considered a large number of environmental factors, their method of comparing pressure kicks that were or were not iced separated into distance bins resulted in sample sizes are concerningly small.
Bilder and Loughlin’s (1998) logistic regression model was revisited by Clark et al. (2013), who used NFL data from 2000-2011 to create their logistic regression model. Their feature selection, included in Table 4, closely mirrors those of Bilder and Loughlin (1998). They compare most of the same explanatory variables, and mostly find the same ones to have meaning. The differences prove more telling than the similarities. Bilder and Loughlin found PAT to be highly significant, though this is a by-product of distance, and so was not even considered by Clark et al. (2013) Clark et al. found field surface, precipitation, and temperature to be extremely significant, whereas Bilder and Loughlin’s results were quite the opposite. Clark et al. reduce the temperature variable to a binary variable for whether or not the temperature at kickoff is below 50℉, perhaps pursuant to Burke’s work (2014b). Additionally, when Bilder and Loughlin looked at “clutch kicking,” they defined it as a kick that would cause a lead change, and found it highly significant (p<0.1), but even when Clark et al. looked at various definitions of pressure situations they could not find any of them to have a significant effect.
Variables
|
Coefficient
|
Standard
Error
|
Wald
Statistic
|
DoF
|
Significance
| |
General1
|
Constant
|
β0=5.953
|
0.220
|
25.2
|
1
|
p<0.0005
|
Distance (yards)
|
βdist = -0.106
|
0.003
|
35.5
|
1
|
p<0.0005
| |
Environmental
|
Cold temperature (<50℉)
|
βcold=-0.341
|
0.061
|
5.63
|
1
|
p<0.0005
|
Field surface (artificial turf)
|
βturf=0.299
|
0.053
|
5.62
|
1
|
p<0.0005
| |
Altitude
(≥4000 ft)2
|
βalt=0.694
|
0.157
|
4.43
|
1
|
p<0.0005
| |
Precipitation
(rain, snow, etc.)3
|
β0=-0.280
|
0.099
|
2.84
|
1
|
p=0.005
| |
Windy
(≥10mph)
|
β0=-0.140
|
0.055
|
2.55
|
1
|
p=0.011
| |
Humid
(≥60%)
|
0.20
|
1
| ||||
Situational/
Psychological
|
Postseason
|
1.29
|
1
| |||
High situational pressure4
|
0.61
|
1
| ||||
Away game5
|
0.67
|
1
| ||||
“Icing the kicker”
(TO before)6
|
1.56
|
1
|
1 All environmental conditions are at kickoff and not specific to the time of each individual kick.
2 The only games played at altitudes greater then 4,000 ft were those in Denver or Mexico City (Oct. 2, 2005).
3 A “chance of rain” is categorized as no precipitation. The model was tested with the alternative categorization, and this had a negligible impact on the value and significance of the coefficient.
4 Several alternate methods of categorizing pressure were tested, none of which were significant. See Appendix.
5 Neutral site games were categorized based upon official distinctions. Treating neutral site games as a third category was still not significant.
6 A timeout called by either head coach was considered “icing the kicker.” Categorizing “icing” as either no timeout, timeout by opposing coach, or timeout by own coach was still not significant.
Armed with a model of field goal expectation based on as many factors as could be shown to be meaningful, all the kickers in the sample were ranked according to average points added per field goal attempt, and looking at best and worst seasons by total points added over expectation. Similarly, a ranking of stadia according to the same metrics, with Denver’s Mile High Stadium unsurprisingly at the top.
Pressure kicks are, with success rate modelling, the most prevalent forms of examination. Building on Berry and Wood (2004), Goldschmied et al. (2010) sought to demonstrate the presence of pressure effects and icing effects, using a much larger data set from the 2002-2007 NFL seasons. A larger data set not only allows for a more granular look at these effects, but also permits the use of more sophisticated methods, those being “a mixed-effects hierarchical linear model with Bernoulli trial outcomes and random-effects for the intercept and all slopes terms” (Goldschmied, Nankin, and Cafri 2010). Over 204 kicks they found a significant (p=0.046) effect on iced kicks vis-a-vis non-iced pressure kicks. While this approach does not explicitly consider the difference in kick distances, the average distance of an iced vs. non-iced pressure kick is 3 yards, well within the standard deviation of both averages and not enough to single-handedly explain the 14 percentage point difference in conversion rate. Since conversion probability is non-linear with respect to distance it is possible that a large number of very unlikely kicks are iced, but there is no evidence to support this. This model is by far the strongest evidence yet proposed for the effects of icing, and the only to credibly defend the concept.
Building on this work, Moede (2014) looked at similar effects in NCAA Division I football from 2006-2012. With 358 “pressure kicks” she found no significant effect from icing a kicker in a pressure situation. The work focused on pressure effects, and so looked at various factors that could increase the perceived pressure of a given kick, but the only predictor of any significance was the distance of the kick.
Ledoux (2016) began his work by replicating Clark et al. (2013), with data from 2012-2013. While his p-values are not meaningfully different, Ledoux argues that in these applied circumstance a p-value of 0.091 is good enough to include icing the kicker as a meaningful explanatory variable. Ledoux does not consider the correlation of iced attempts with increased distance.
Ledoux (2016) looked at each individual stadium as a dummy variable, but collinearity problems led him to abandon this approach, concluding that “each stadium dummy is going to be highly correlated with its home-city’s climate conditions and the type of surface of its playing field.” One must also consider that each stadium is going to be highly affected by the home team’s kicker. Ultimately he settles on the same explanatory variables as Clark et al. (2013), with his results shown in Table 5. Like other models seen here, he uses his model to rate kickers and to compare the validity of a kicker’s field goal conversion percentage.
Variable
|
Coefficient
|
Standard Error
|
p-value
|
Intercept
|
5.5089
|
0.1361
|
0.0000
|
Distance (yards)
|
-0.1026
|
0.0030
|
0.0000
|
Cold (<50℉)
|
-0.2170
|
0.0780
|
0.0053
|
Precipitation
|
-0.3264
|
0.1062
|
0.0021
|
Windy (≥10mph)
|
-0.1730
|
0.0573
|
0.0025
|
Turf
|
0.3301
|
0.0548
|
0.0000
|
Altitude (≥4000ft)
|
0.8225
|
0.3213
|
0.0104
|
Iced
|
-0.1730
|
0.1024
|
0.0913
|
Where Ledoux (2016) goes beyond the work of others is in his introduction of more sophisticated methods. While logistic regression has been the industry standard from Berry and Berry (1985) to Bilder and Loughlin (1998) through Clark et al. (2013) Ledoux introduces machine learning techniques, with “random forests, neural networks, multiple linear regression, and hybrid models.” Random forests proved ill-suited, perhaps due to the abundance of binary explanatory variables, taking away from the strength of random forests to find the best decision point along a continuous variable. Neural networks are known to do well when handling interactions between features, and this model showed the best results of any of the models tried, albeit at the expense of a long model training time that could hinder such a model’s ability to be tweaked. Multiple linear regression and certain hybrid models were developed but did not give any better results than previous models.
4. Conclusion
When discussing the development of statistical analysis of field goal kicking we can comfortably say that logistic regression is very popular and that people are very interested in knowing whether icing is effective. Regarding logits, the method is certainly an appropriate choice, and it does make for some comparable models, we can see that several similar models made by different people on similar data produce similar results. While this is a touch truistic this replication is an encouraging sign. It may now be time to use more sophisticated methods, such as Ledoux’s (2016) neural networks. Logistic regression, even of the piecewise variety used by Golschmied et al. (2010) is still in the family of linear models, and is ill-adapted for discontinuous and interacting predictors.
Because of the NFL’s gametracking only making note of weather conditions at kickoff it is very difficult to incorporate these environmental effects with any kind of accuracy, short of some method of scraping local meteorological information over the timeframe of the game and having a way to at least approximate the real-world time of different in-game effects.
Icing the kicker is a long-standing tradition, and like many behaviours described thusly, is of dubious value. Only a single work (Goldschmied, Nankin, and Cafri 2010) found any support for it, and that with a stated goal to do so. Conversely, an overwhelming majority of other works failed to find meaningful effects for either icing the kicker or clutch kicking, or failed to demonstrate methodological rigour.
With growing sample sizes as digitized data becomes available, and improved computing power becoming ever more available, better understanding of different predictors will become possible, and better models become practical choices. Nonlinear models offer the hope of a better understanding of the various interactions in football.
Ultimately distance is the overwhelming factor in determining a field goal attempt’s probability of being successful. The inclusion of environmental factors can improve a model, and situational factors may someday prove their worth, but distance is king.
5. References
Burke, Brian. 2008. “Just for Kicks.” Advanced Football Analytics. November 16, 2008. http://archive.advancedfootballanalytics.com/2008/11/just-for-kicks.html.
———. 2009. “Does FG Accuracy Decline In Clutch Situations?” Advanced Football Analytics. October 25, 2009. http://archive.advancedfootballanalytics.com/2009/10/does-fg-accuracy-decline-in-clutch.html.
———. 2014a. “Altitude and Field Goals - Advanced Football Analytics.” Advanced Football Analytics. November 17, 2014. http://www.advancedfootballanalytics.com/index.php/home/research/weather/132-altitude-and-field-goals.
———. 2014b. “Temperature and Field Goals - Advanced Football Analytics.” Advanced Football Analytics. December 17, 2014. http://www.advancedfootballanalytics.com/index.php/home/research/weather/165-temperature-and-field-goals.
Clark, Torin, Aaron Johnson, and Alexander Stimpson. 2013. “Going for Three: Predicting the Likelihood of Field Goal Success with Logistic Regression.” In The 7th Annual MIT Sloan Sports Analytics Conference. http://www.sloansportsconference.com/wp-content/uploads/2013/Going%20for%20Three%20Predicting%20the%20Likelihood%20of%20Field%20Goal%20Success%20with%20Logistic%20Regression.pdf.
LeDoux, James. 2016. “Extra Point Under Review: Machine Learning And The NFL Field Goal.” Elements 12 (2). https://doi.org/10.6017/eurj.v12i2.9448.
Moede, Karen. 2014. “Pressure Kicks: The Effects of Distracting Variables on the Outcome of a Pressure Kick in Division-I College Football.” Clemson University. https://tigerprints.clemson.edu/all_theses/1903/.
Pasteur, R. Drew, and Kyle Cunningham-Rhoads. 2014. “An Expectation-Based Metric for NFL Field Goal Kickers.” Journal of Quantitative Analysis in Sports 10 (1). https://doi.org/10.1515/jqas-2013-0039.
Skerda, Brandon. 2016. “Mixpanel’s Game Theory: Does Icing the Kicker Work?” Mixpanel. November 22, 2016. https://mixpanel.com/blog/2016/11/22/nfl-data-icing-the-kicker/.


No comments:
Post a Comment