1. Abstract
A study of the development of research on punting in football. Punting is shown to have improved steadily over time, by both measures of yardage and more sophisticated measures such as Expected Points (EP). The existing official statistics are criticized and being result-oriented without regard to the process or factors beyond the punter’s control. Better measures are suggested and a method of assessing punts relative to their expectation based on a large number of environmental and circumstantial factors to rate punters independently of their opportunities.
2. Introduction
As much as the punt has been maligned by every version of fourth down study produced, even the most ardent supporter of the go-for-it movement concedes its occasional utility. As research has developed in other areas of the game the punt has lagged behind somewhat, but there is still a certain body of work worth examining, one which approaches the issue from several angles. Most importantly we must consider how to isolate work of the punter from the end result of the punt, which can be variously affected by the coverage team, the return team, and even the weather.
3. Punting
A trio from the Royal Military College of Canada (Brimberg, Hurley, and Johnson 1999), this author’s alma mater, looked at the question of not so much the punter, but rather the returner, and used a geometric approach to determine his ideal placement to return punts, and compared the alignments of single punt returners as opposed to pairs of punt returners aligned either horizontally or vertically to optimize the percentage of punts fielded. Through the use of CIAU (now U Sports) data they determined that two returners spaced horizontally provided only a modest improvement in punt fielding rate over a single returner, and that when the punter was not intentionally trying to punt away from the returner that a vertical arrangement outperformed a horizontal one. Through the use of some elementary physics they isolate the orthogonal components of a punt’s flight, and found that gross punt distance correlates linearly with hang time. In the case of a single returner, the returner should align himself where he expects the ball to land along the horizontal axis but somewhat closer to the line of scrimmage, since a longer punt will have a longer hang time and thus give more opportunity for the returner. The algebraic solution to the problem proves to be a triple integral with no analytic solution, and numerical methods of the mid-1990’s proved too slow. Instead, Monte Carlo methods were used, modelling the punts as a gamma distribution and using the 40-yard dash times of some CIAU punt returners as estimates to generate examples of ideal alignment.
For a single returner they found the optimal distance to be somewhat shorter than the expected kick, allowing 56.7% of kicks to be fielded. This number underestimates the true value because an individual kicker would show less variance in kicking than the aggregate of all kickers. Furthermore, while the authors state that this is an upper-bound because they have not considered the effects of the sidelines, this is perhaps looking at the question backwards. A punt that goes directly out of bounds is, effectively, one that is fielded, or at the very least should not be considered in the determination. Incorporating this would allow the returner to better position himself in the knowledge that he need not concern himself with reaching a punt that is out of bounds.
When two returners are used there is an increase in fielding rate of five percentage points, which is hardly surprising, and the distance is the same for one returner or two. The more interesting conclusion is that while teams using two returners almost invariably place them side-by-side at the same depth, there is a large benefit to instead placing them one behind the other. This leads to an increase of 10 percentage points over the horizontal alignment. While this research only looked at punters who were not directionalizing, that is, that their punts were not aimed with respect to the location of the returners, the results are stark enough to suggest merit in further research, especially with modern computing that can permit us to consider the effects of sidelines and even directionalized punts.
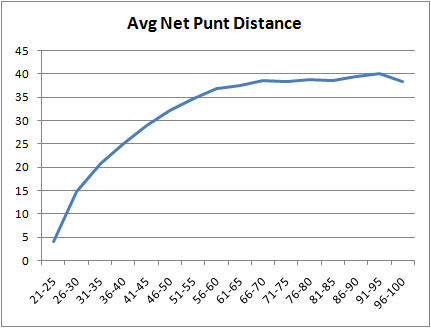
Brian Burke (2008), titan of football analytics, put out a collection of his musings on the kicking game. He plotted the net punting distance of NFL punts against field position. Burker’s graph is shown in Figure 1. Unfortunately here Brian does not do any deeper analysis, he simply provides the output: average net punting distance by field position of the play, binned into five-yard intervals. If we are to do our own analysis the average gain is constant until the 45-yard line, where it begins a roughly linear decline until the 25-yard line as the effects of field compression limit the gain of the punt. The last data point Burke acknowledges as a bizarre outlier, a fake field goal punt.
Burke (2010) would expand on his analysis of punting two years later with a case study of Shane Lechler, and to what extent Lechler’s prodigious punting statistics are drive by the Oakland Raiders’ anemic offense,. Burke builds on the graph we see in Figure 1, plotting by individual yard lines instead of five yard groups, as shown in Figure 2. The finer resolution does not alter the basic conclusion above. The central question to Burke’s piece was the quantification of the value of individual punters, isolated from the situations in which they punt, by calculating the Expected Points (EP) and Win Probability (WP) added over the average punter, using EPA per kick and total WPA to estimate the value of a kicker while limiting the impact of the situations from which a punter operates.

Burke (2014) continued his work on the value of punting, showing the average resultant EP of a punt by field position, included here in Figure 3. Obviously the EP value of a punt increases as distance from the end zone decreases, but the slope of the graph in Figure 3 decreases as we approach the end zone, while we know that the value of going for it increases linearly (Clement 2018) with field position between the 20-yard lines.

Through the community developed within Burke’s site, Beuoy (2012) looked at year-over-year improvement of punters through gross and net punting, showing consistent improvement over time as shown in Table 1. Beouy separately examines punts from more than 65 yards away from the goal line, and shows an even stronger relationship between time and punting yardage. Every measure of punting ability shows improvement over a ten-year period: touchback rate decreases, fair catch rate increases, both gross and net yardage increase over time.
Season
|
Net
|
Gross
|
2002
|
34.4
|
40.1
|
2003
|
34.5
|
40.4
|
2004
|
35.9
|
41.3
|
2005
|
36.6
|
41.6
|
2006
|
36.8
|
42.8
|
2007
|
36.4
|
42.3
|
2008
|
37.2
|
43.1
|
2009
|
37.8
|
43.2
|
2010
|
37.1
|
42.8
|
2011
|
38.2
|
43.9
|
Tymins (2014) was the first to formally publish a focussed examination of punts. Tymins looked at the average net field position gain of punts relative to starting field position, creating the graph shown below in Figure 4. Tymins fitted a cubic function to the data, though we question whether plotting the final field position against the starting field position would have yielded a simpler regression. Tymins stated goal was to develop a system of rating punters vis-à-vis the league average. In light of this, and wanting to isolate the punter from his circumstances beyond his control, Tymins used an EP framework to rate punters based on their EPA over average at that field position. Tymins does not explicitly cite his EP model but give his heavy citation throughout, the known collaboration, and the timing of the publication it can be presumed that this is Burke’s (2008) model at work.

If we might permit ourselves a moment of criticism, Tymin’s step of using EP to level the playing field of opportunities ameliorates but hardly resolves the problem. First there is the issue of quantity, that some punters will receive vastly more opportunities to punt and therefore inflate their statistics. Second, as the field becomes compressed there are fewer expected points over average available to be gained by a punter. Given that over 13,000 punts were included in this study it is reasonable to believe that we could create a model of the distribution of EP for punts at each yard line. From there we can assign every punt a z-score within that distribution, and rate punters according to the average z-score of their punts.
Benjamin Morris (2017), then with the leading data science collective FiveThirtyEight, exalted the state of the modern kicking game. Morris demonstrated a five-yard increase in both gross and net punting between 2002-2003 and 2014-2015, remarking that these improvements, along with the associated improvements in field goal kicking, have had a significant impact on the 4th down calculators, pushing a number of decisions in favour of kicking, a slight course correction to the oft-repeated mantra that kicking and punting are vastly overrated and overused.
Former NFL punter Chris Kluwe (2014) provided a synopsis of punting and the statistics behind it, explaining the flaws in the NFL’s punting stats and their limitations in how punters can be assessed. Kluwe also discusses the factors of a punt that are more directly related to performance, and better isolate the kicker’s performance from that of his teammates. This stands in contrast to the current state of affairs where the existing metrics heavily favour punters who kick from farther back, as is shown by Pro Bowl punters being disproportionately selected from teams with worse records (Lisk 2008). Kluwe looks at the ways that punters should be assessed and the metrics that should be used, as well as how they should be interpreted. He discusses the need for more granular kicking statistics, and proposes a system of equivalence between his different metrics that would allow for a more direct comparison of kicks, and his work helped to develop the Pro Football Focus model for rating punters. Kluwe’s process-based approach contrasts with all prior efforts that are results-driven and context-dependent.
In keeping with a focus on process-drive, kicker-focused methods of evaluation, Pasteur et al. (2018) watched NFL game film of all punts from the 2013 season to manually record data on hang time, distance, and location, as well as tracking game wind and weather conditions. The team separated fly distance and gross distance, the later including any bounce or roll prior to being downed or touched by the returning team. Finally, effective net distance includes penalties applied to the punting play. The various confounding elements of evaluating punts are discussed, such as how increased distance also allows longer returns, somewhat negating the added distance. This effort also included developing a model of expected bounce effects based on field position and punt distance, an attempt to control for one of the most unpredictable aspects of the game, applying the modeled expectation to the evaluation instead of the actual bounce. Through repeated simulation they sought to determine the best predictive metrics for each set of circumstances. To control for the quality of the punt coverage they used points per game allowed by the kicking team’s defense. Even as a first-order approximation this is a dubious parallel.
Given the most predictive environmental factors and circumstances of the punt, Pasteur could then calculate a prior expected EP for a punt, and by incorporating the variables relating to the punt itself (hang time, distance, lateral positioning) he could determine an expected EP for the punt. The difference of these two is the punt’s EPA, and a punter’s EPA/punt can be used as a means of rating his performance. Plotting punters expected EP vs estimated EP shows punters’ performances in relation to one another. Consistent with prior research (Burke 2010), Shane Lechler has both the most expected EP, a product of punting for a bad team, but also the most EPA/punt of all league punters.
4. Conclusion
While certainly an undervalued field of research, study of punting in football has made progress in recent years, even if the officially tracked statistics have not evolved as a result. We have clear and convincing evidence that punters and punt units are improving dramatically with time, in such a way as to sway optimal fourth-down decision-making. We still lack a thorough understanding of the means to isolate a punter’s performance and t properly evaluate him relative to the circumstances in which he works. Pasteur’s (2018) work builds on Kluwe’s (2014) proposition, but is too laborious to continue without additional resources, as it demands that each kick be manually timed and the environmental effects must also be searched by hand and incorporated. It becomes incumbent on the league, then, to track better raw statistics for analysis, especially better tracking of wind and weather conditions and hang time. While the punting may be a disdainful task, and one whose role in football is diminishing over time, its study may not be neglected. It remains, apart from kickoffs, the play in which the most yardage is exchanged at once, and that carries with it large risks and opportunities for both teams.
5. References
Beuoy, M. 2012. “Are Punters Getting Better.” http://community.advancednflstats.com/2012/11/are-punters-getting-better.html.
Burke, Brian. 2008a. “Expected Points.” Advanced Football Analytics. August 2008. http://archive.advancedfootballanalytics.com/2008/08/expected-points.html.
———. 2008b. “Just for Kicks.” Advanced Football Analytics. November 16, 2008. http://archive.advancedfootballanalytics.com/2008/11/just-for-kicks.html.
———. 2010. “Shane Lechler Is Overrated...Or Is He?” Advanced Football Analytics. January 4, 2010. http://archive.advancedfootballanalytics.com/2010/01/shane-lechler-is-overratedor-is-he.html.
———. 2014. “4th Down Study - Advanced Football Analytics.” Advanced Football Analytics. November 12, 2014. http://www.advancedfootballanalytics.com/index.php/home/research/game-strategy/120-4th-down-study.
Clement, Christopher M. 2018. “Score, Score, Score Some More: Expected Points in American Football.” June 5, 2018. https://passesandpatterns.blogspot.com/2018/06/score-score-score-some-more-expected.html.
Kluwe, Chris. 2014. “Punt Game: Sportsballing Really Hard With Your Foot.” Pro Football Focus. June 11, 2014. https://www.profootballfocus.com/news/punt-game-sportsballing-really-hard-with-your-foot.
Lisk, Jason. 2008. “Pro Bowl Punters.” Pro Football Reference. July 24, 2008. https://www.pro-football-reference.com/blog/index03c9.html?p=563.


No comments:
Post a Comment