Showing posts with label EP. Show all posts

Saturday, May 9, 2020

Getting Things Started: Kickoffs in U Sports

1. Abstract

Kickoffs in U Sports are examined according to their net, gross, and spread yardage, as well as their EP values, considering both the point estimates of the mean and the overall distributions. Kickoffs from the 75-yard line, associated with safeties, are found to behave differently from other kickoffs, generally associated with touchdowns. This leads to the creation of the “good team hypothesis,” discussed in further detail below. The impact of rouges is also discussed, especially vis-à-vis their value in punting situations, owing to differing rules for kicks out-of-bounds. Rouges are much more desirable for kickoffs, where a “coffin corner” kick is not an option. While gross kick yardage varies with field position, kick return distance is only minimally impacted by field position, and is much more stable across field position. This is consistent with extant domain wisdom, that a longer kick allows a longer return before the coverage team can meet it.

Friday, January 24, 2020

The Numbers Behind the Numbers: EP Classification Models at the Class Level

1. Abstract

Using the three highest-performing models from the previous examination of EP classification models (Clement 2019a), this work looks at how well these models are able to predict the individual classes of future scoring. The k-Nearest Neighbours (kNN) model performs adequately, but not as well as the Multi-Layer Perceptron (MLP) and Gradient Boosting Classifier (GBC), which performed very well, the GBC slightly better than the MLP. The models all show bias by quarter, demonstrating the need to include game time as a factor, and home-field advantage. Future work will involve feature selection and fine-tuning of the MLP and GBC models. 

Wednesday, January 1, 2020

Reverting to the Mean: Regression EP Models in U Sports Football

1. Abstract

A set of five different regression models were tested as measures of Expected Points, parallelling prior work in the field (Clement 2019) - the Multi-Layer Perceptron, Stochastic Gradient Descent, Elastic Net, Ada Boost, and Bayesian Ridge models. The model outputs were viewed and compared to the results of the raw data, and calibration graphs for each model were developed, as well as calibration graphs broken down by down, quarter, and home/away. The Multi-Layer Perceptron proved the only effective model, with the Elastic Net and Bayesian Ridge models effective only in certain limited circumstances, the Ada Boost is of very limited use, and the Stochastic Gradient Descent proved completely useless as a predictor of Expected Points.

Friday, July 19, 2019

It’s Up and It’s Good: Field Goals in U Sports

1. Abstract
A continuation of a series of works developing the individual parts of a future third-down decision-making model using discrete individual models. Raw data for P(FG) shows that P(FG)GOOD declines linearly with increasing kick distance, as does EP(FG). Five different classification models were used to assess P(FG) based on various features relevant to field goal attempts (distance, elevation, temperature, wind, weather). The random forest model proved most effective, with the best correlation measures both by RMSE and R2. Distance remains the strongest and best predictor of P(FG), dwarfing all other factors.

Monday, June 10, 2019

It's a Game of Field Position: Punting in U Sports Football

1. Abstract

An analysis of the objective measures of punting in U Sports football,. This work looks at gross, net, and EP values of punts by yardline and compares them to one another. All measures are shown to have cubic fits. Punt spread is also examined as the difference between gross and net punting. Punts are heavily compressed with decreasing yardline below 50 yards, and conversely increase significantly in value with increasing yardline above 90 yards. While the first of these is expected, the second is unexpected. Further research is necessary, with the preliminary hypothesis that it stems from a selection bias of only teams that punt well choosing to punt from those situations.

Thursday, February 21, 2019

It’s Spelt “Rouge:” Expected Points in U Sports

1. Abstract

For an existing database of U Sports play-by-play data five different models were created to look at Expected Points in U Sports football. The results of these models are presented, in addition to the results of the raw data, allowing the models to be compared to the raw data and against one another. Furthermore, extensive correlation graphs are presented to allow models to be assessed based on their effectiveness in predicting EP. The multi-layer perceptron model proves itself to be the most effective across all scenarios, followed by the gradient boosting and k-nearest neighbours models. The random forest and logistic regression models proved poor estimators of EP and are contraindicated for future use.

Thursday, January 24, 2019

New Year, New Data: Additions to the Passes and Patterns Knowledge Base

1. Abstract

    An update on the developments affecting the various articles previously published in this space, covering both the analyses of other work and original research. Datasets for original research have been updated with 2018 data for both the CFL and U Sports. Previously written state of the art pieces that have seen new work in the field include a postscript to the original work to fold in the new research. Finally, original research previously done has been updated with the new data brought in.
    The critical developments covered here include an American P(1D) (Pelechrinis and Papalexakis 2016b) model that shows non-linearity for 3rd down in a manner similar to that previously found in Canadian football (Clement 2018e, [g] 2018), and the development of a WP model for Canadian football (Thiel 2019).

    Thursday, August 23, 2018

    Due North: Analytics Research in Canadian Football

    1-Abstract

    A broad survey of the history of scholarship in Canadian football analytics as relates to in-game decision-making. Works discussed span from 1982 to 2016, and while most focus on CFL data there does exist some mention of Canadian university football research (then CIS, now known as U Sports). Eleven different works covering a variety of topics create the basis of modern analytics in Canadian football.

    Tuesday, June 5, 2018

    Score, Score, Score Some More: Expected Points in American Football

    1 – Abstract
    A continuation of prior efforts to consolidate the body of knowledge in American football analytics (Clement 2018), this work discusses the development of Expected Points as an analytical model over the past decades, with a focus on results, statistical methods, data management techniques, and historiographical change.
    The development of EP over the past forty years has shown development in statistical techniques employed, growing from linear approximations based on two data points to advanced smoothing techniques and non-linear fits. This growth is aided by the exponential growth in dataset sizes that has paralleled the rise in cheaply available computing.

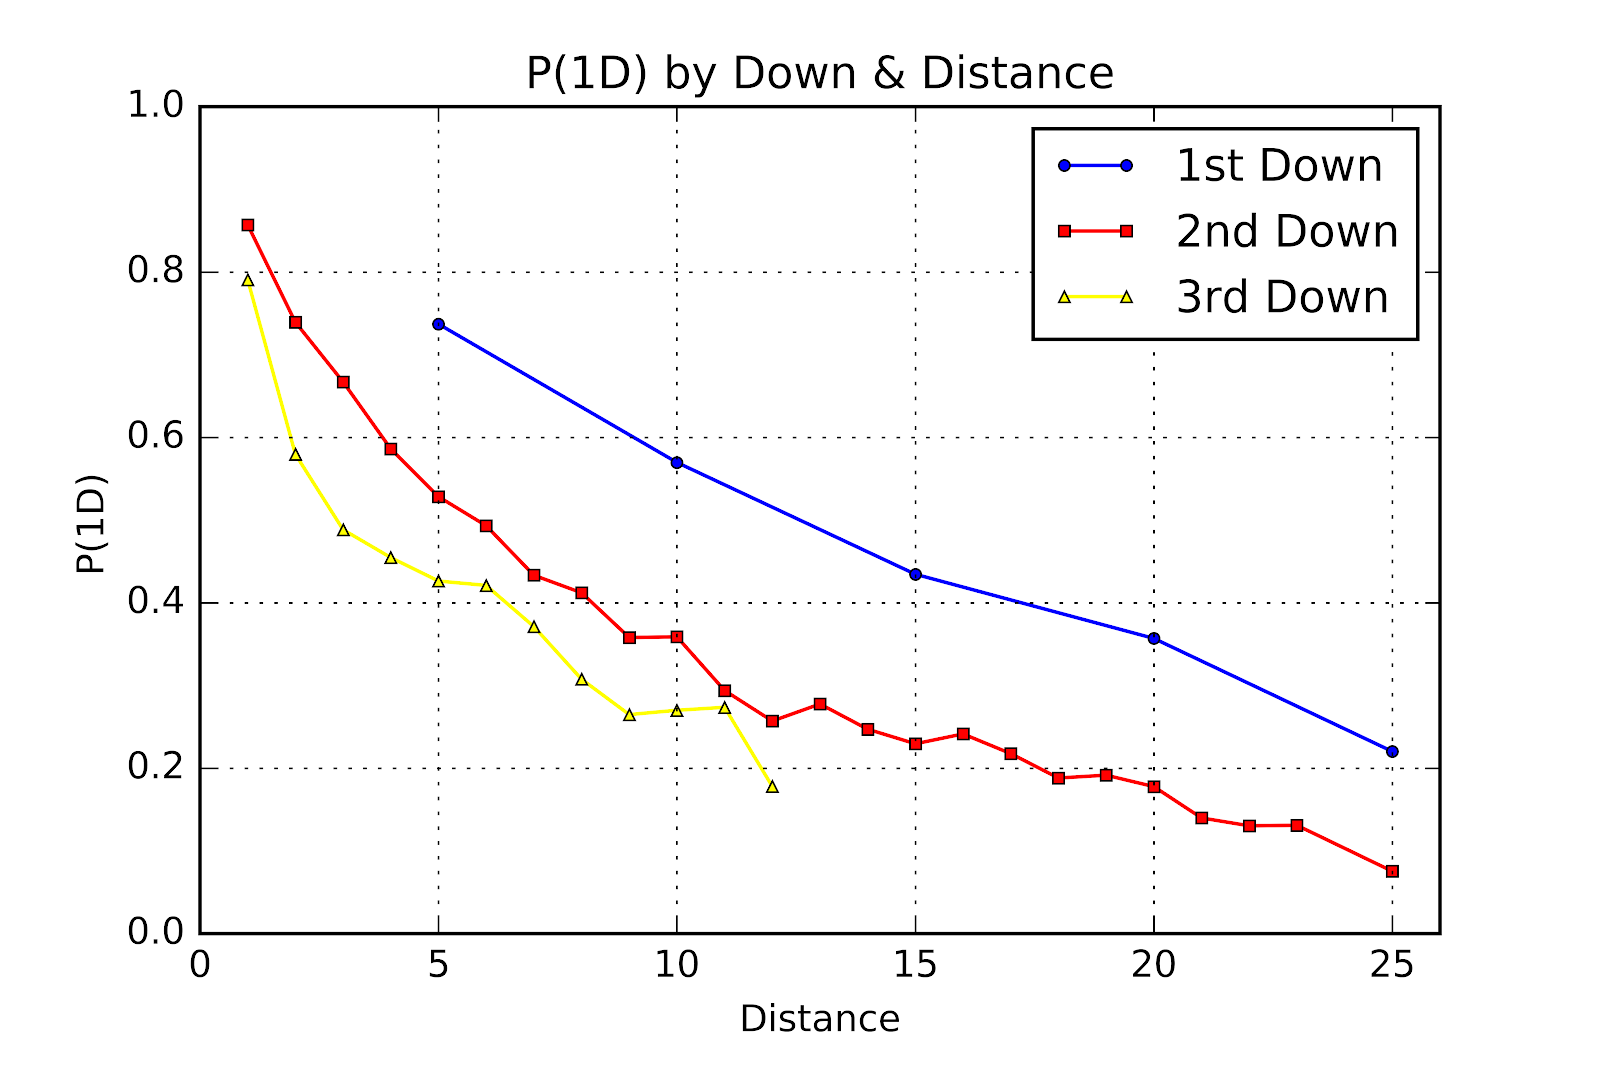
    Three Downs Away: P(1D) In U Sports Football

    1-Abstract A data set of U Sports football play-by-play data was analyzed to determine the First Down Probability (P(1D)) of down & d...