1. Abstract
Kickoffs in U Sports are examined according to their net, gross, and spread yardage, as well as their EP values, considering both the point estimates of the mean and the overall distributions. Kickoffs from the 75-yard line, associated with safeties, are found to behave differently from other kickoffs, generally associated with touchdowns. This leads to the creation of the “good team hypothesis,” discussed in further detail below. The impact of rouges is also discussed, especially vis-à-vis their value in punting situations, owing to differing rules for kicks out-of-bounds. Rouges are much more desirable for kickoffs, where a “coffin corner” kick is not an option. While gross kick yardage varies with field position, kick return distance is only minimally impacted by field position, and is much more stable across field position. This is consistent with extant domain wisdom, that a longer kick allows a longer return before the coverage team can meet it.
2. Introduction
The Passes & Patterns corpus already contains examinations of existing scholarship covering all three aspects of the kicking game (Clement 2018b, [b] 2019, [a] 2019), as well as novel research into both punts and field goals in U Sports football (Clement 2020b, [c] 2019). Kickoffs are the simplest of these to examine, as they occur almost exclusively at discrete 5-yard intervals, overwhelmingly dominated by kickoffs at the -45 yard line, being the default for kickoffs after touchdowns, or the -35 yard line, following safeties.
3. Kickoffs
In parsing the data, there are three main data that we are able to extract. The first is the gross yardage of the kick, the distance from where the ball is kicked to where the ball is next touched. When the kick goes out of bounds the gross length goes to where the ball went out of bounds. The net distance of the kick is the distance from where the ball was kicked to where the ball ends up at the end of the play. For touchdowns this is all the way back to the goal line, and for other plays this is measured based on the field position of the next play. Finally there is the Expected Points (EP) value of the play. This is the value of future scoring from a given down, distance, and field position state (Clement 2018a). Here we use raw EP, that being the simple averaging of all future scoring from that situation, rather than using one of our models (Clement 2020a), because the EP values all relate to 1st & 10 situations, with very limited exceptions in cases of dead ball fouls. The sample sizes are all sufficiently large to use raw EP, and so this is considered preferable to the modeled equivalent, inasmuch as there is any difference at all. For kicks where both the gross and net distance are available, we can calculate the spread, the difference between the two. Generally this is the length of the kickoff return, but would also include any penalties assessed.
Certain disclaimers about the data: intentional squib kicks and onside kicks have not been filtered out. Since these are rarely tagged in the data it would be difficult to effectively do so. In principle we could try to filter out very short kicks for the onside kicks, or remove all kickoffs in the latter parts of each half, but these will be left for future work, we will use a naive approach and include all the relevant data.
a. Yardage
There are three general considerations to kickoffs: the kick, the coverage, and the return. The interplay between these three can be difficult to tease apart, but we can make certain efforts to do so where possible. In the first place we can look at the gross yardage of the kick. This is the distance the kick covers from the point where it is kicked to the point where it is recovered. Since few kickers can reach the goal line from the -45 yard line, and all kickers can outkick the coverage team, unlike a punt, so kickers are generally incentivized to kick the ball as far as possible, with some regard for placement. In Figure 1 we can see both the gross and net yardage for kickoffs by the kickoff yard line, with error bars for the 95% confidence intervals of the mean bootstrapped from the results. Table 1 also includes the data for Figure 1.
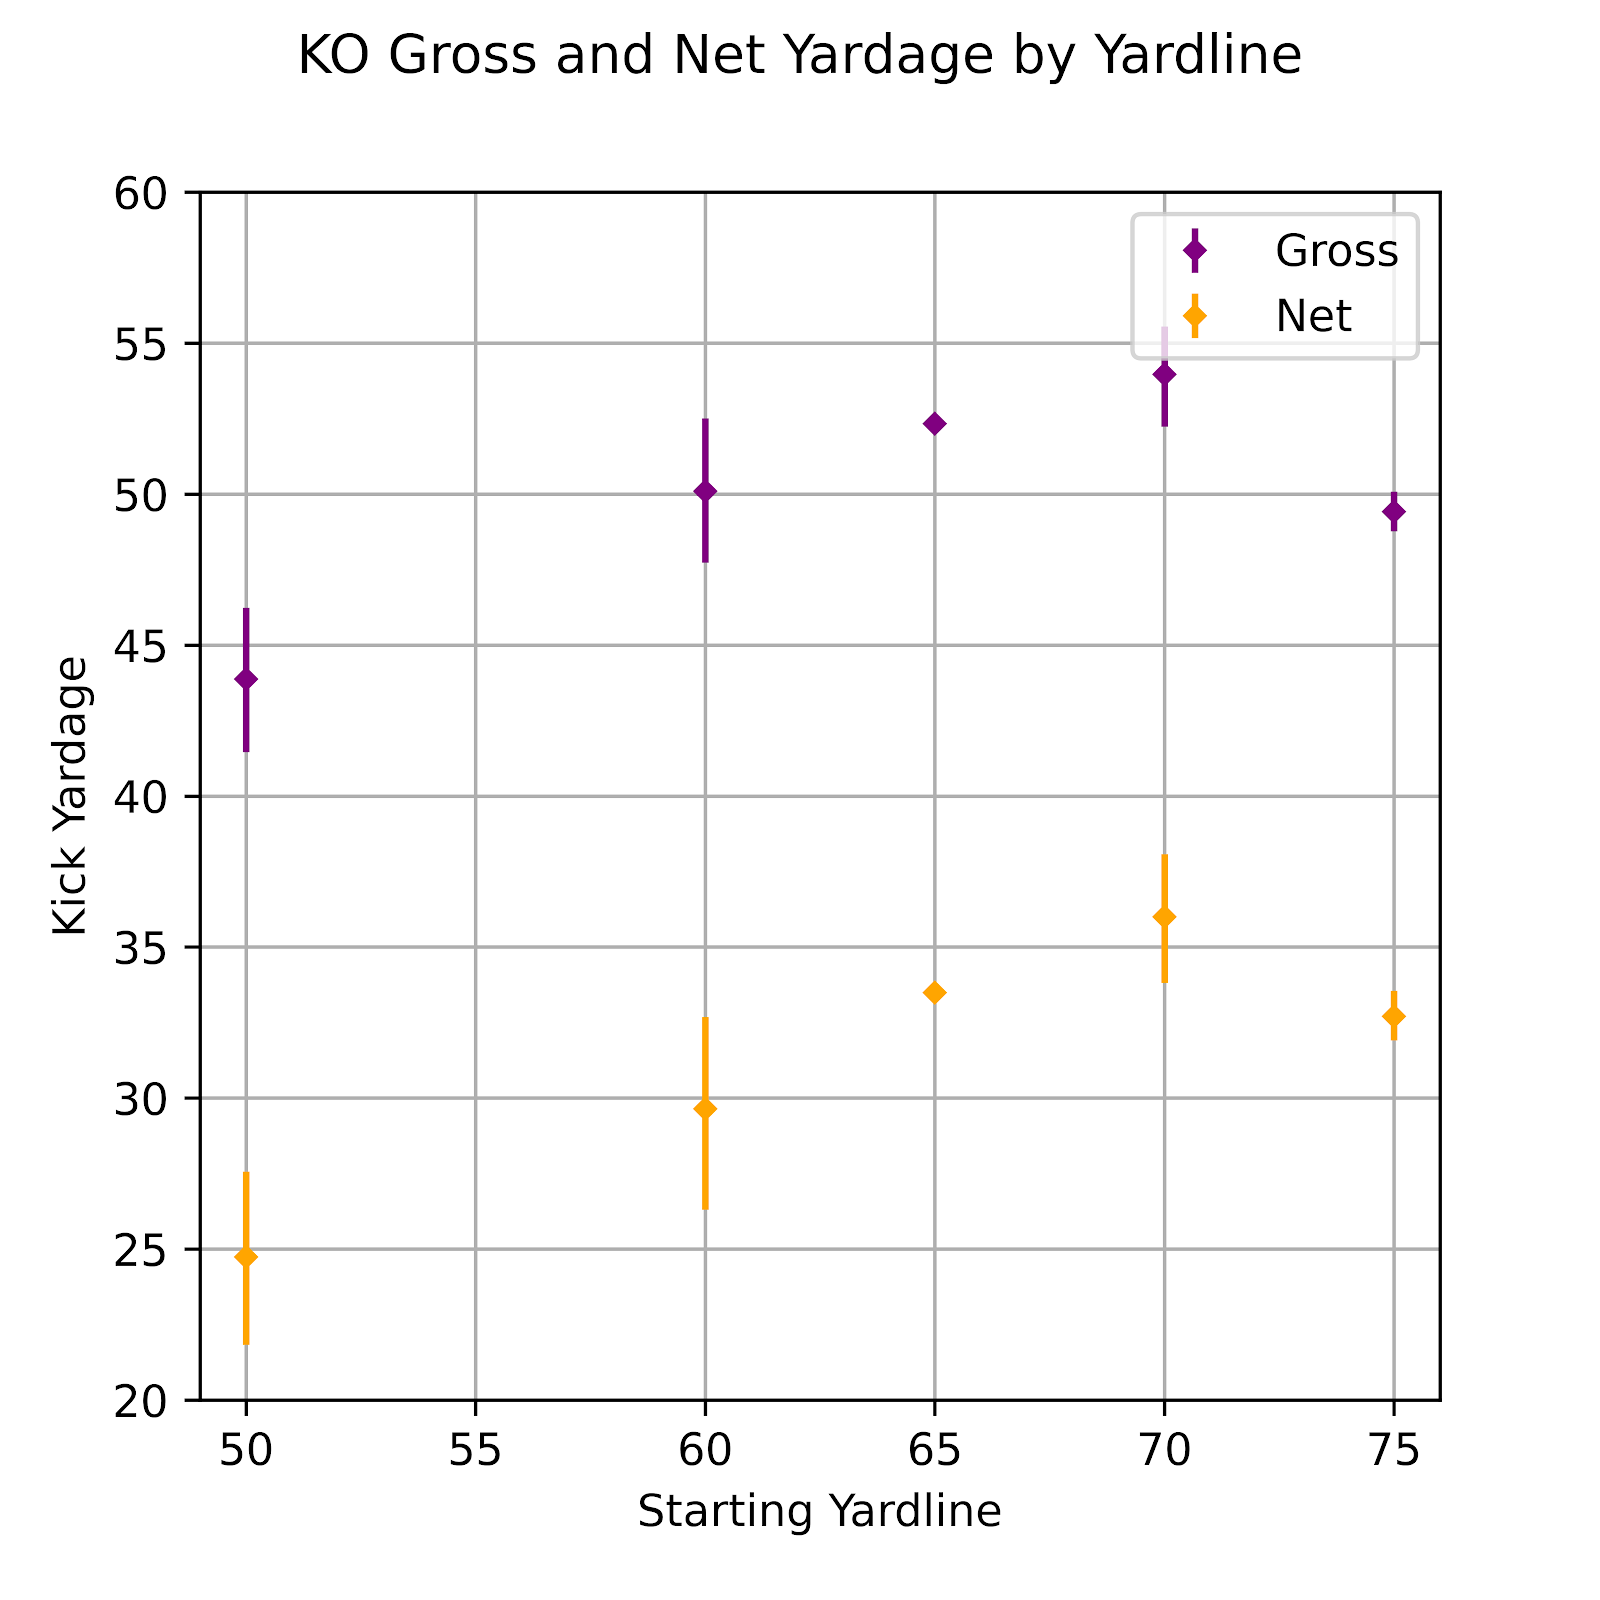
Figure 1 Gross and Net Kickoff Yardage by Field Position
Table 1 Gross and Net Kickoff Yardage by Field Position
In Figure 1 we can first look at which yardlines are present. The 65-yard line data point is where kickoffs are kicked after touchdowns. It, unsurprisingly, has error bars too small to be seen. The 75-yard line is for kickoffs following safeties and has similarly small error bars, albeit slightly larger. The other points are the product of penalties (and, indeed, there is some measure of crossover between the 65- and 75-yard lines). Note that there is no data point at the 55-yard line. There are few 10-yard penalties that would be applied to the receiving team, either on a kickoff, on the play preceding a kickoff (generally a field goal or PAT), or as a dead-ball foul. The 50-yard line kickoffs are the result of 15-yard penalties against the returning team, a common occurrence.
Comparing the gross and net yardage, we see they track fairly closely, and seem to increase more-or-less linearly over the first four data, with a sharp dropoff for the last one. We propose a hypothesis here: that the first four points are the product of kickers trying to place the ball, hence the gross yardage increasing at a slope of slightly less than 1, and are dominated by teams that score more often, i.e. better teams, with generally better kickers. Conversely, the teams kicking from the 75-yard line are those who have surrendered safeties, and tend to be comparatively bad teams, with worse kickers. They do not kick as far, and the net yardage on kickoffs follows. This could be considered an example of the “bad team hypothesis,” which can be seen in various specific situations all over football, such as how EP for 1st & 10 at the -35-yard line is notably lower, since this is mostly the result of teams scrimmaging at this point after having allowed a field goal, and bad teams allow more field goals. We also see in Figure 2 that gross and net kickoff yardage track very closely.
In order to better visualize the relationship between gross and net kicking we can look at Figure 2, where we have a scatter plot of all kicks plotting gross vs net yardage.The opacity of each point is reduced in order to let us visualize where data is most concentrated by the darkness of the dots.
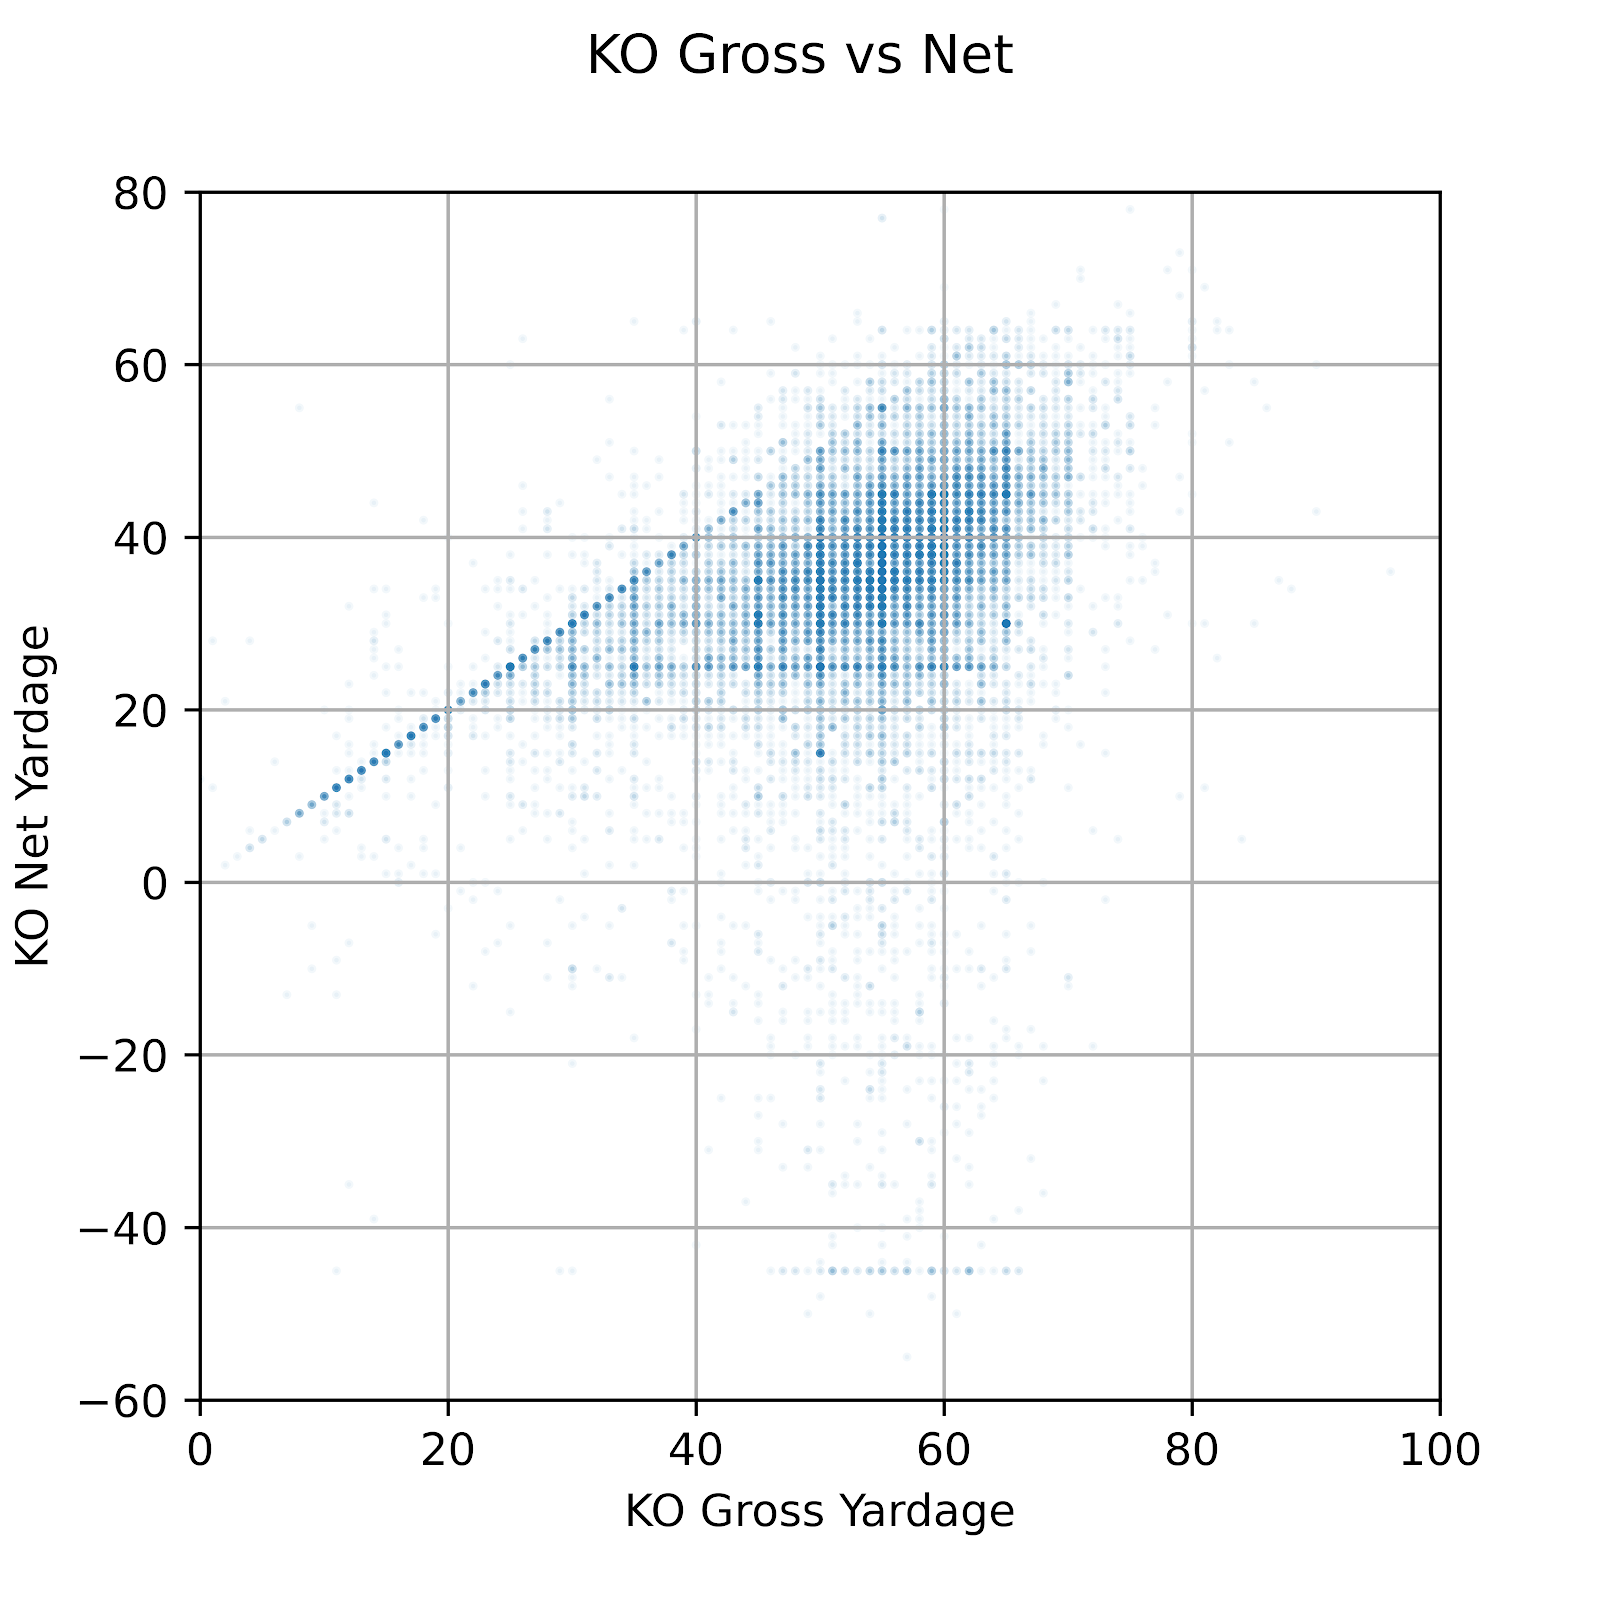
Figure 2 Kickoff Net by Kickoff Gross Yardage
The first thing to note is a line along y=x. These are kicks with no return, and bound the darker region of the plot. Negative returns are fairly rare, but it is common for kicks with a shorter gross yardage - generally indicative of pooch or squib kicks - to be recovered without necessarily any intent of returning them. Additionally, we see below this line a roughly ovaloid shape that is darker than the rest of the graph. This is the bulk of kickoffs, where net yardage tracks pretty closely with gross yardage. A longer kick is a good thing, unsurprisingly. Falling away from this oval is a smattering of points going down the graph, these are longer returns, until we get to -65 yards, which is the collection of return touchdowns, and some longer ones
In Figure 3 we look at the spread yardage by yardline. We should expect to see spread yardage be largely unrelated to the spot of the kick. If the kick is not bounded by the goal line, then it doesn’t much matter where the kick happens, it would simply be a lateral translation. And yet, in Figure 3 we do not see that. We see spread yardage decreasing with increasing yardline. The exception to this are the kickoffs at the 50, the shortest ones, but the error bars are extremely wide here. Even the kickoffs from the 75, which so far have stood alone as the oddball in prior Figures, are in line.
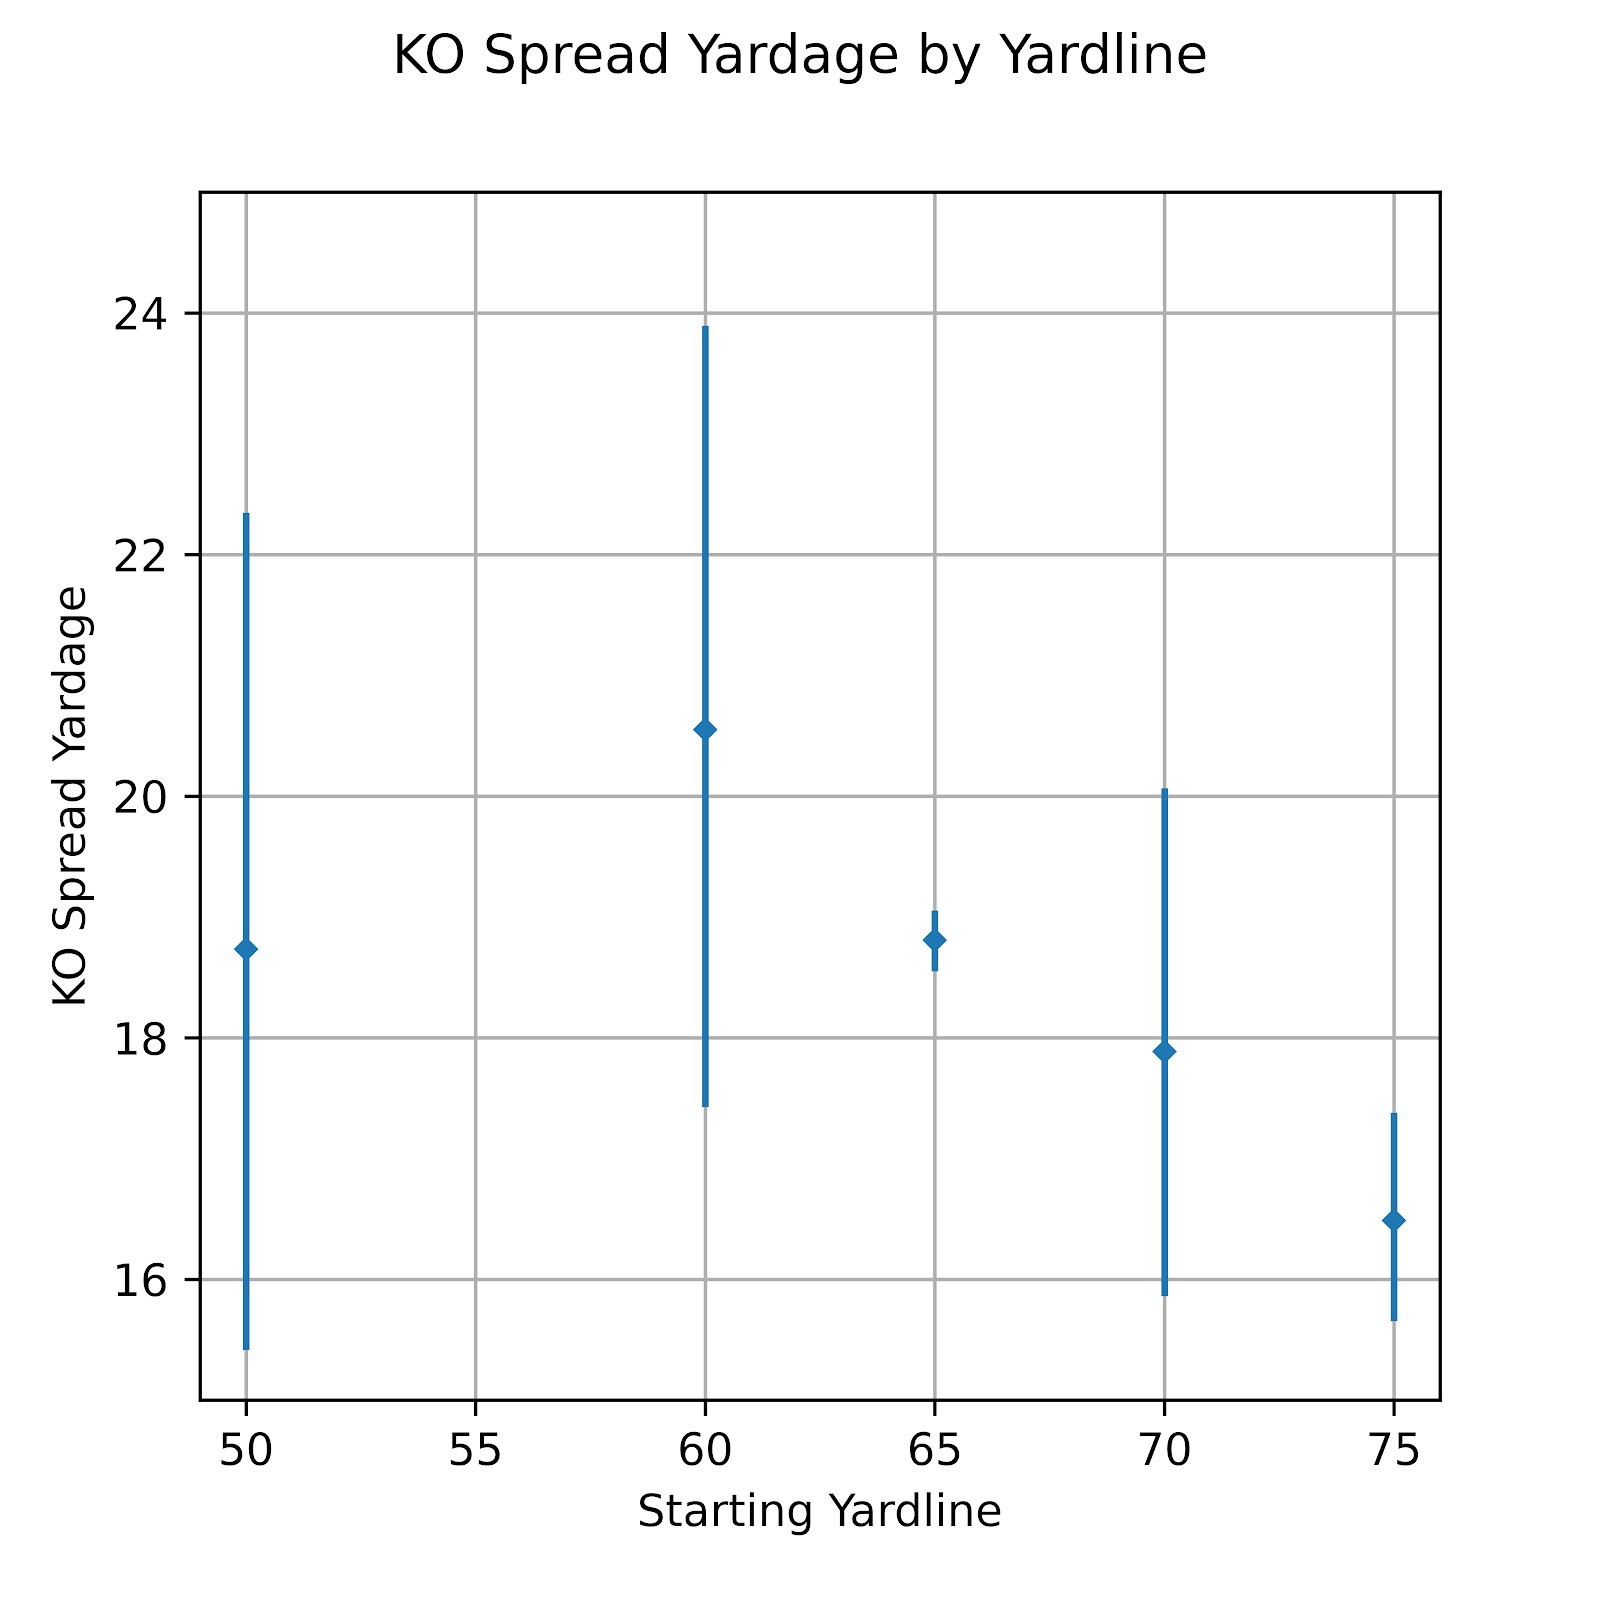
Figure 3 Kickoff Spread Yardage by Field Position
If we are considering why spread yardage might be so wide
Table 2 Kickoff Spread Yardage by Field Position
We first note that while the x-axis has been kept consistent, the datum at the 50-yard line is missing. This is because there are less than 100 kickoffs where both the gross and net yardage could be parsed. While the four other data are roughly linearly correlated, the difference between the average spread yardage for a kickoff from the 60- and the 75-yard lines is less than 4 yards, and the confidence interval for the kicks at the 70- and 60-yard lines are so large as to each encompass all the other data. All we can say here is that the spread for kicks from the 75 have a smaller spread than those from the 65, however given that they have less net yardage and much less gross yardage, it likely speaks to the idea that the kicks themselves are just much shorter, and so the coverage team and return team begin much closer to one another. This is consistent with the bad team theory. Rouges will also play a factor. The gross yardage of a rouge goes as far back as where it was caught, but it’s net yardage will be the 35-yard line. This could be a 55-yard difference, but is actually a net positive, as will be discussed later, because it comes with a point. Rouges are much easier as the kickoff is moved forward, hence compressing net yardage.
b. Expected Points (EP)
While yardage can give us a good sense of the difference in kickoff situations, in order to get a better sense of the context, as well as to allow kickoffs to be compared to other plays, we must look toward expected points (EP). EP accounts for the non-linearity in values of different yards, and more importantly considers the impact of rouges. In terms of yardage, rouges are extremely deleterious to net yardage, but since they provide a real point of value on the scoreboard, they are approximately as valuable as even a kickoff downed at the 1-yard line. If a kicker could consistently kick for rouges they would negate any risk of a return and provide the maximum possible value to the kicking team.
Figure 4 shows the EP of kickoffs by their initial field position. This is the post-facto EP, that is, the average of the ensuing situation. This is important because otherwise kickoffs would have a very high EP if their EP was simply calculated based on the next scoring play. This is the corollary to the bad team hypothesis, the good team hypothesis. Good teams score more, and so kickoff more, so the conclusion would be that teams which kickoff are very likely to score next. Thus we are not measuring the actual value of the kickoff, but merely gathering an artefact of how the game is played. Instead we look at the EP value of the succeeding situations. For example, if a kickoff results with the opponent having possession on the 30 yard line, we would take the EP value of 1st & 10 from the 30. Another kickoff that leads to possession at th 20, and one to the 15, we would average the EP values of 1st & 10 from the 30, 20, and 15 yard lines, these values themselves being the averages of all 1st & 10 plays from those yardlines. By this manner we look to dilute the effect of stronger teams kicking off more frequently.

Figure 4 Kickoff EP by field position
Table 3 Kickoff EP by field position
When looking at the EP values in Figure 4 it is important to note the established convention from Passes & Patterns that everything is calculated from Team A’s perspective. On kickoffs that refers to the kicking team. Ergo, a higher EP is preferable for the kicking team. This is why we see EP decreasing as the kick moves backward. Specifically relating to rouges, we see that EP at 50 is significantly higher than at 60, 65, and 70. This can be attributed to rouges, which are worth 0.59 points. If a team can get a rouge on a kickoff, it should do so with the sole exception of onside kicks. It is vastly improbable that a returned kickoff will be stopped in a situation that is more advantageous to the kicking team. This is, of course, not so easily done, but the notion of an intentional high and short kick requires that the returner be stopped short of the 15-yard line to be better than the rouge. With the return rules structured to encourage returns out of the end zone this may prove difficult but should remain a consideration. Indeed, a kicker who can deliver a rouge 50% of the time is worth 1-2 points a game over an average kicker. When considering the best uses of the final roster spots this is a far greater expected marginal value than one would expect from an additional substitute at any other position.
While all the previous graphs have given point estimates of the mean and confidence intervals of that mean, they do not necessarily show the variance specific to a given kickoff. For this we look to Figure 5, where we can see probability density plots of each of the 5 kickoff yardlines seen above, those with sufficient sample size.

Figure 5 Kickoff EP Distribution by Field Position
In Figure 5 we see a surprising degree of normality in most of the plots. Only the 65-yard line shows this non-normality, surprising given that it has, by far, the largest sample size. We also see that as we go down the distributions slowly shift to the left, as we would expect.
At the 75-, 60-, and 50-yard lines there are very normal-looking distributions, with some skew. We would expect to see a second hump at around -7 EP, where we would see the effect of return touchdowns, but it appears that these are sufficiently rare as to have minimal impact. For the 50-yard line we see a small but distinct hump at +3 EP, likely the result of return teams eventually conceding a safety. This raises a complicated issue for prescriptive analytics. If we assume perfect play from rational actors, many elements of prescriptive analytics are relatively simple. We can simulate the rational choices of the opponent at each turn, and extrapolate the probabilistic outcomes. But if we allow for imperfect play, if we assume that opponents are likely to make choices against their own self-interest for whatever reason, then determining the optimal choice is much more difficult, since the set of irrational decisions is very large, and some of these are far more likely than others. Indeed, some of these decisions may themselves be rational, but the result of perverse incentives, such as coaches trying to “keep a game close” while surrendering Win Probability in order to save face, in the knowledge that other people external to the game may not view the situation rationally. While further work is required to prove out this suggestion, it is the strong belief of the author that intentional safeties are vastly overused, and their strategic applications are very limited.
4. Conclusion
The key takeaway from this work is that there are two distinct “types” of kickoffs. There are regular kickoffs, mostly taken by teams who have just scored a touchdown or a field goal, and kickoffs from teams who have just surrendered safeties. Implicit in this distinction is the difference in team strengths. Better teams score more and give up fewer safeties, they kick the ball farther and cover it better. Kickoffs from the -45-yard line are as close to having no net value as is reasonably possible. Kickoffs are the simplest special teams play to analyze, but must not be neglected. As we have seen with safeties (Clement 2020a), the nominal point value of a scoring play can differ substantially from it’s true value once one considers the impact of the ensuing kickoff.
5. References
Clement, Christopher M. 2018a. “Score, Score, Score Some More: Expected Points in American Football.” Passes & Patterns. June 5, 2018. http://passesandpatterns.blogspot.com/2018/06/score-score-score-some-more-expected.html.
———. 2018b. “Three Point Plays: The Analytics of Field Goals.” Passes & Patterns. December 17, 2018. https://passesandpatterns.blogspot.com/2018/12/three-point-plays-analytics-of-field.html.
———. 2019a. “Given the Boot: The Analytics of Kickoffs.” Passes & Patterns. January 7, 2019. https://passesandpatterns.blogspot.com/2019/01/given-boot-analytics-of-kickoffs.html.
———. 2019b. “Kick It Away, Kick It Away, Kick It Away Now: The Analytics of Punting.” Passes & Patterns. June 10, 2019. https://passesandpatterns.blogspot.com/2018/10/kick-it-away-kick-it-away-kick-it-away.html.
———. 2019c. “It’s Up and It’s Good: Field Goals in U Sports.” Passes & Patterns. July 19, 2019. https://passesandpatterns.blogspot.com/2019/07/its-up-and-its-good-field-goals-in-u.html.


No comments:
Post a Comment