Thursday, January 24, 2019

New Year, New Data: Additions to the Passes and Patterns Knowledge Base

1. Abstract

    An update on the developments affecting the various articles previously published in this space, covering both the analyses of other work and original research. Datasets for original research have been updated with 2018 data for both the CFL and U Sports. Previously written state of the art pieces that have seen new work in the field include a postscript to the original work to fold in the new research. Finally, original research previously done has been updated with the new data brought in.
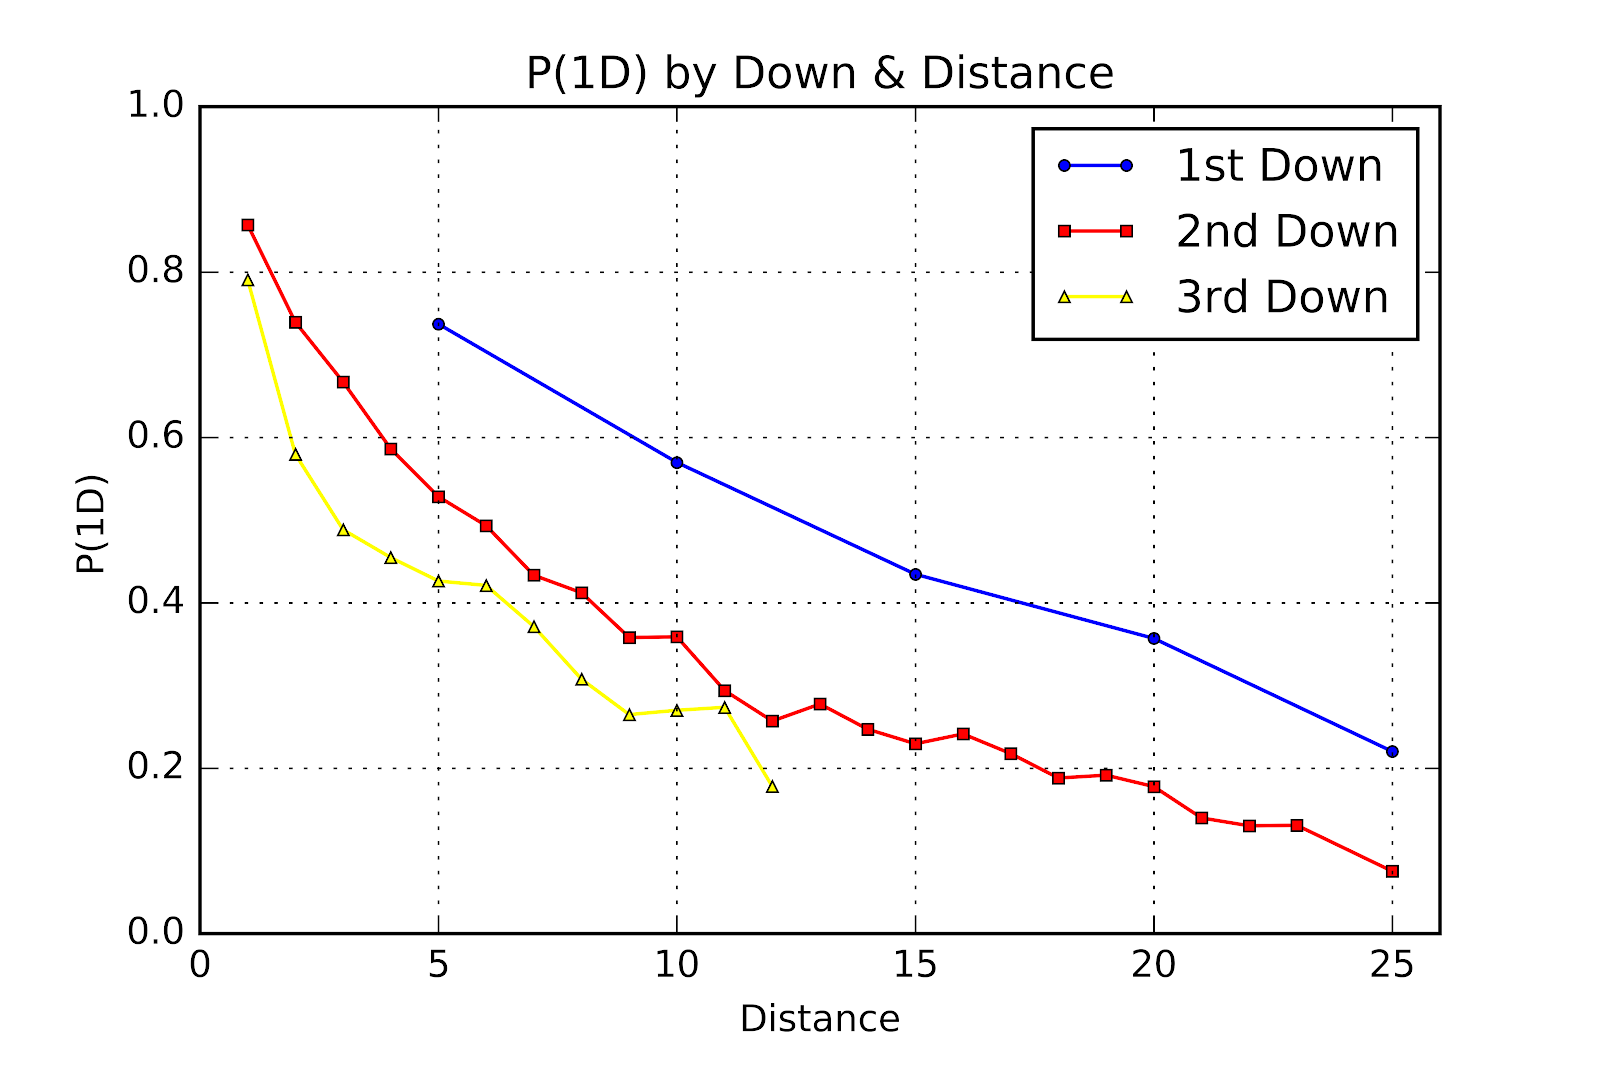
    The critical developments covered here include an American P(1D) (Pelechrinis and Papalexakis 2016b) model that shows non-linearity for 3rd down in a manner similar to that previously found in Canadian football (Clement 2018e, [g] 2018), and the development of a WP model for Canadian football (Thiel 2019).

    Monday, January 7, 2019

    Given the Boot: The Analytics of Kickoffs

    1. Abstract

    The third piece in a series on the current state of affairs regarding analytical research into football’s kicking plays, this piece looks at kickoffs. The broad conclusions to draw from the corpus are that the rule changes regarding touchbacks have had a major impact in reducing the number of kickoff returns and negatively impacting the starting field position after a kickoff; and that onside kicks are underutilized. Their success rate is almost entirely dependent on whether or not the kicking team is obliged by game situation to attempt an onside kick, and non-necessary onside kicks have a far higher success rate, high enough that their use is currently an under-exploited area of opportunity.

    Monday, December 17, 2018

    Three Point Plays: The Analytics of Field Goals

    1. Abstract

    A look at the development of models determining field goal probability, and related studies of meaningful predictor variables. Logistic regression is the most common way of incorporating different predictor values, with a single example of a neural network. Distance is unfailingly the strongest predictor of success, and by an order of magnitude over any other variable. Useful environmental variables also include wind, rain, and altitude. The question of clutch kicking is discussed ad nauseum, with a general consensus of there being little effect if any, and icing the kicker similarly finds little support in most works, in some cases even contraindicated.

    Thursday, October 18, 2018

    Kick it Away, Kick it Away, Kick it Away Now: The Analytics of Punting


      1. Abstract


      A study of the development of research on punting in football. Punting is shown to have improved steadily over time, by both measures of yardage and more sophisticated measures such as Expected Points (EP). The existing official statistics are criticized and being result-oriented without regard to the process or factors beyond the punter’s control. Better measures are suggested and a method of assessing punts relative to their expectation based on a large number of environmental and circumstantial factors to rate punters independently of their opportunities.

      Saturday, October 13, 2018

      The Roman Numerals of Computing: An Object-Oriented Database of U Sports Football

      1. Abstract

      A redevelopment of the U Sports parser and calculator previously described (Clement 2018b) that was built using VBA, this time working in Python. Data is imported through Python’s csv package, and parsed using an object-oriented approach, creating games and plays as classes with attributes as appropriate to each. Further objects exist to support analysis on the parsed data, and the numpy package with its arrays allows for far faster calculation of results. Discussion of future work built on this restructured database includes examination of special teams, expected points (EP) and Win Probability (WP).

      Monday, September 17, 2018

      The Whole Ten Yards: P(1D) in the CFL

      1-Abstract

      P(1D) values across down and distance were calculated for CFL data across down & distance. & Goal situations were separated and viewed independently. Results were compared to results obtained using the same methods on U Sports data. CFL offenses generally follow the same trends as seen in U Sports in terms of P(1D), though CFL P(1D) is consistently ~5 percentage points higher than U Sports under the same conditions. 1st down follows the same linear trend, while 2nd down shows exponential decay, with the previously discussed “Stupidity Asymptote” at 10%. However, CFL teams are markedly less willing to attempt 3rd down conversions, causing a lack of usable data points for 3rd down. For & goal situations the disparity between CFL and U Sports P(1D) does not seem to be as prevalent.

      Friday, August 31, 2018

      Appendix to Going Pro: Developing a CFL Play-by-Play Database

      6-Appendix 1: List of Games

      The table below provides a complete list of all the games for which play-by-play data has been found and included in the database as of the date of publication. The games are listed chronologically by date played, oldest game first.

      Three Downs Away: P(1D) In U Sports Football

      1-Abstract A data set of U Sports football play-by-play data was analyzed to determine the First Down Probability (P(1D)) of down & d...