Friday, January 24, 2020

The Numbers Behind the Numbers: EP Classification Models at the Class Level

1. Abstract

Using the three highest-performing models from the previous examination of EP classification models (Clement 2019a), this work looks at how well these models are able to predict the individual classes of future scoring. The k-Nearest Neighbours (kNN) model performs adequately, but not as well as the Multi-Layer Perceptron (MLP) and Gradient Boosting Classifier (GBC), which performed very well, the GBC slightly better than the MLP. The models all show bias by quarter, demonstrating the need to include game time as a factor, and home-field advantage. Future work will involve feature selection and fine-tuning of the MLP and GBC models. 

Monday, January 6, 2020

Fresh Start: 2019 Play-by-Play Data in the Passes & Patterns Database


1. Abstract

New play-by-play data from the 2019 U Sports and CFL seasons was added to the Passes & Patterns Database. 125 games and 21,549 plays were added to the U Sports database, while 95 games and 14,025 plays were added to the CFL database. All data was cleaned and error-checked to fit with existing data format standards. A new scraper was developed in Python to streamline the CFL data collection process.

Wednesday, January 1, 2020

Reverting to the Mean: Regression EP Models in U Sports Football

1. Abstract

A set of five different regression models were tested as measures of Expected Points, parallelling prior work in the field (Clement 2019) - the Multi-Layer Perceptron, Stochastic Gradient Descent, Elastic Net, Ada Boost, and Bayesian Ridge models. The model outputs were viewed and compared to the results of the raw data, and calibration graphs for each model were developed, as well as calibration graphs broken down by down, quarter, and home/away. The Multi-Layer Perceptron proved the only effective model, with the Elastic Net and Bayesian Ridge models effective only in certain limited circumstances, the Ada Boost is of very limited use, and the Stochastic Gradient Descent proved completely useless as a predictor of Expected Points.

Friday, July 19, 2019

It’s Up and It’s Good: Field Goals in U Sports

1. Abstract
A continuation of a series of works developing the individual parts of a future third-down decision-making model using discrete individual models. Raw data for P(FG) shows that P(FG)GOOD declines linearly with increasing kick distance, as does EP(FG). Five different classification models were used to assess P(FG) based on various features relevant to field goal attempts (distance, elevation, temperature, wind, weather). The random forest model proved most effective, with the best correlation measures both by RMSE and R2. Distance remains the strongest and best predictor of P(FG), dwarfing all other factors.

Monday, June 10, 2019

It's a Game of Field Position: Punting in U Sports Football

1. Abstract

An analysis of the objective measures of punting in U Sports football,. This work looks at gross, net, and EP values of punts by yardline and compares them to one another. All measures are shown to have cubic fits. Punt spread is also examined as the difference between gross and net punting. Punts are heavily compressed with decreasing yardline below 50 yards, and conversely increase significantly in value with increasing yardline above 90 yards. While the first of these is expected, the second is unexpected. Further research is necessary, with the preliminary hypothesis that it stems from a selection bias of only teams that punt well choosing to punt from those situations.

Wednesday, April 3, 2019

Rain or Shine: Incorporating Weather Data into the U Sports Database

1. Abstract

METAR weather data was compiled for the seasons and locations of games within the existing U Sports database by scraping three different sources of archived data. Within the parser, METARs covering the dates and times of games were attached in a list to the game objects. Plays within each game were given an estimated real-world time, and each play was then assigned the METAR nearest to it. Future applications of weather data include its use in development of field goal models, examining the impact of weather on various existing analyses, and contextualizing future research.

Wednesday, March 6, 2019

Home Sweet Home: Football Stadia in Canada

1. Abstract
Data for all 43 stadia in the existing U Sports and CFL databases (Clement 2018a, [b] 2018) was accumulated, with various contextual features for each stadium, and incorporated into a Python dict to attach the appropriate stadium object to each game object. Stadium data includes geographic data, architectural data, and references to allow further development of weather data. The structure of the dict allows the addition of future attributes and stadia as required.

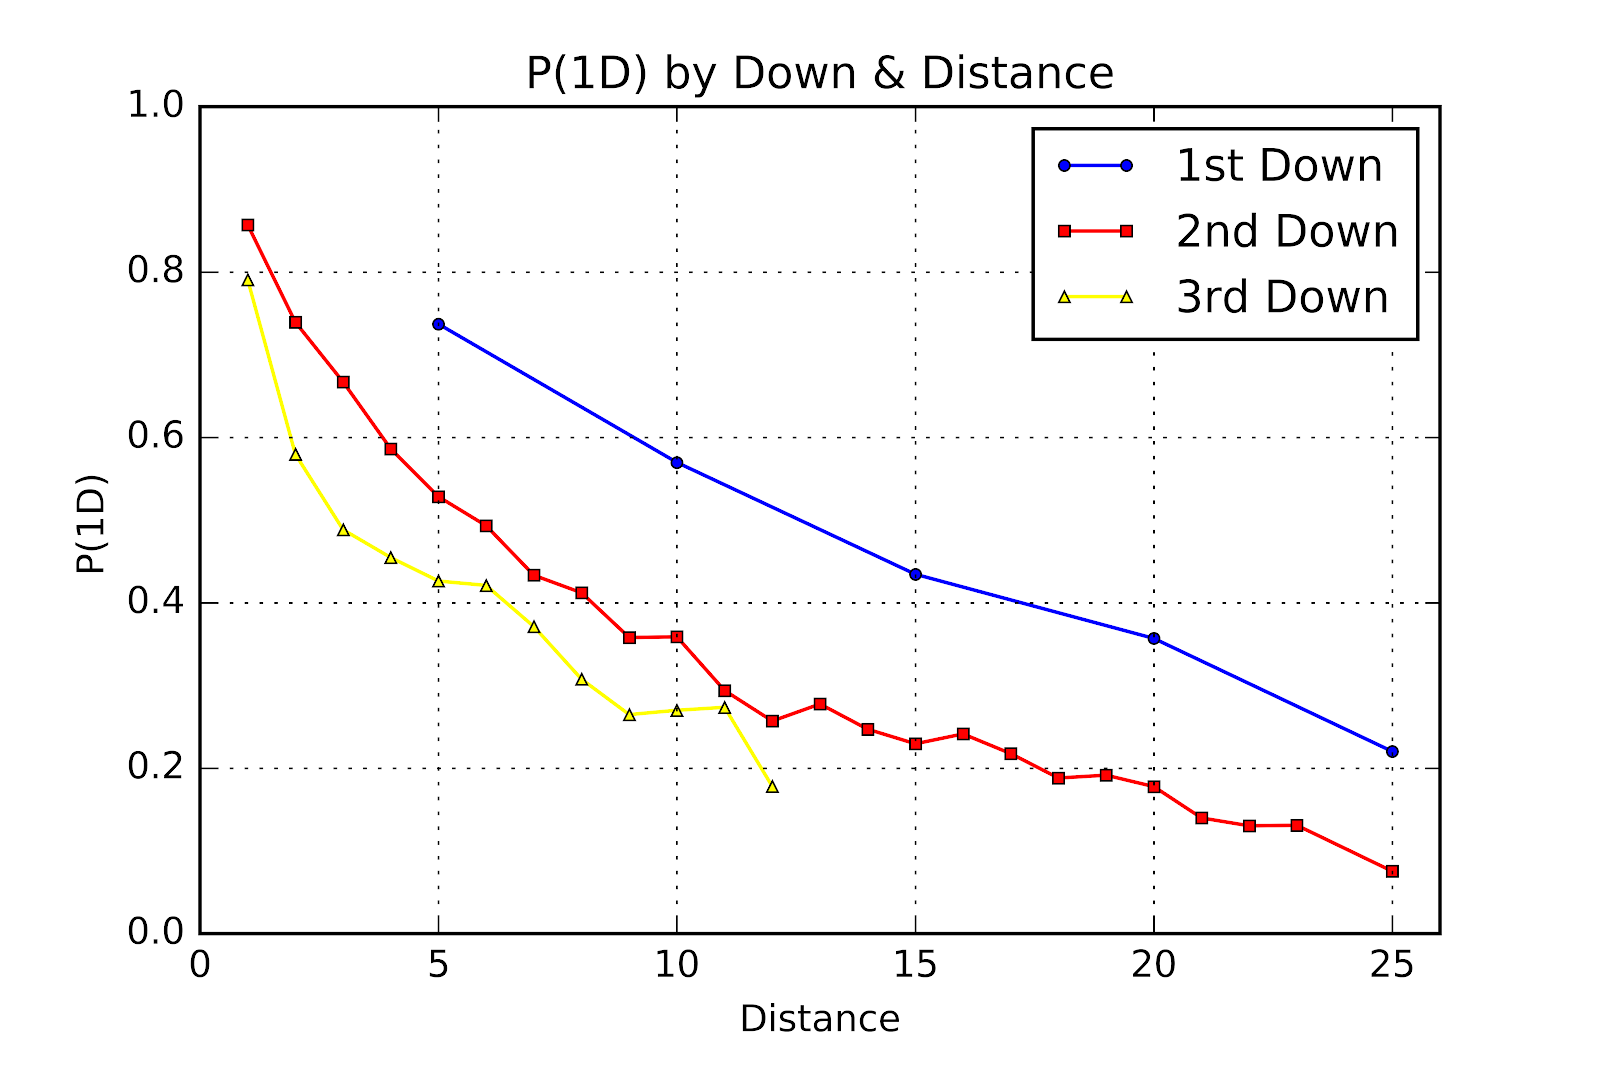
Three Downs Away: P(1D) In U Sports Football

1-Abstract A data set of U Sports football play-by-play data was analyzed to determine the First Down Probability (P(1D)) of down & d...