Saturday, May 9, 2020

Getting Things Started: Kickoffs in U Sports

1. Abstract

Kickoffs in U Sports are examined according to their net, gross, and spread yardage, as well as their EP values, considering both the point estimates of the mean and the overall distributions. Kickoffs from the 75-yard line, associated with safeties, are found to behave differently from other kickoffs, generally associated with touchdowns. This leads to the creation of the “good team hypothesis,” discussed in further detail below. The impact of rouges is also discussed, especially vis-à-vis their value in punting situations, owing to differing rules for kicks out-of-bounds. Rouges are much more desirable for kickoffs, where a “coffin corner” kick is not an option. While gross kick yardage varies with field position, kick return distance is only minimally impacted by field position, and is much more stable across field position. This is consistent with extant domain wisdom, that a longer kick allows a longer return before the coverage team can meet it.

Sunday, January 26, 2020

A Team Game: Team Objects in the Passes & Patterns Code

1. Abstract

A custom class was created for teams in the Passes & Patterns database in order to hold metadata about each team, held in a dict accessible globally. Linking to relevant game objects will allow much more efficient team-specific analysis and centralize team meta-data. Future development involves creating player-level objects and linking team logo objects.

Friday, January 24, 2020

The Numbers Behind the Numbers: EP Classification Models at the Class Level

1. Abstract

Using the three highest-performing models from the previous examination of EP classification models (Clement 2019a), this work looks at how well these models are able to predict the individual classes of future scoring. The k-Nearest Neighbours (kNN) model performs adequately, but not as well as the Multi-Layer Perceptron (MLP) and Gradient Boosting Classifier (GBC), which performed very well, the GBC slightly better than the MLP. The models all show bias by quarter, demonstrating the need to include game time as a factor, and home-field advantage. Future work will involve feature selection and fine-tuning of the MLP and GBC models. 

Monday, January 6, 2020

Fresh Start: 2019 Play-by-Play Data in the Passes & Patterns Database


1. Abstract

New play-by-play data from the 2019 U Sports and CFL seasons was added to the Passes & Patterns Database. 125 games and 21,549 plays were added to the U Sports database, while 95 games and 14,025 plays were added to the CFL database. All data was cleaned and error-checked to fit with existing data format standards. A new scraper was developed in Python to streamline the CFL data collection process.

Wednesday, January 1, 2020

Reverting to the Mean: Regression EP Models in U Sports Football

1. Abstract

A set of five different regression models were tested as measures of Expected Points, parallelling prior work in the field (Clement 2019) - the Multi-Layer Perceptron, Stochastic Gradient Descent, Elastic Net, Ada Boost, and Bayesian Ridge models. The model outputs were viewed and compared to the results of the raw data, and calibration graphs for each model were developed, as well as calibration graphs broken down by down, quarter, and home/away. The Multi-Layer Perceptron proved the only effective model, with the Elastic Net and Bayesian Ridge models effective only in certain limited circumstances, the Ada Boost is of very limited use, and the Stochastic Gradient Descent proved completely useless as a predictor of Expected Points.

Friday, July 19, 2019

It’s Up and It’s Good: Field Goals in U Sports

1. Abstract
A continuation of a series of works developing the individual parts of a future third-down decision-making model using discrete individual models. Raw data for P(FG) shows that P(FG)GOOD declines linearly with increasing kick distance, as does EP(FG). Five different classification models were used to assess P(FG) based on various features relevant to field goal attempts (distance, elevation, temperature, wind, weather). The random forest model proved most effective, with the best correlation measures both by RMSE and R2. Distance remains the strongest and best predictor of P(FG), dwarfing all other factors.

Monday, June 10, 2019

It's a Game of Field Position: Punting in U Sports Football

1. Abstract

An analysis of the objective measures of punting in U Sports football,. This work looks at gross, net, and EP values of punts by yardline and compares them to one another. All measures are shown to have cubic fits. Punt spread is also examined as the difference between gross and net punting. Punts are heavily compressed with decreasing yardline below 50 yards, and conversely increase significantly in value with increasing yardline above 90 yards. While the first of these is expected, the second is unexpected. Further research is necessary, with the preliminary hypothesis that it stems from a selection bias of only teams that punt well choosing to punt from those situations.

Wednesday, April 3, 2019

Rain or Shine: Incorporating Weather Data into the U Sports Database

1. Abstract

METAR weather data was compiled for the seasons and locations of games within the existing U Sports database by scraping three different sources of archived data. Within the parser, METARs covering the dates and times of games were attached in a list to the game objects. Plays within each game were given an estimated real-world time, and each play was then assigned the METAR nearest to it. Future applications of weather data include its use in development of field goal models, examining the impact of weather on various existing analyses, and contextualizing future research.

Wednesday, March 6, 2019

Home Sweet Home: Football Stadia in Canada

1. Abstract
Data for all 43 stadia in the existing U Sports and CFL databases (Clement 2018a, [b] 2018) was accumulated, with various contextual features for each stadium, and incorporated into a Python dict to attach the appropriate stadium object to each game object. Stadium data includes geographic data, architectural data, and references to allow further development of weather data. The structure of the dict allows the addition of future attributes and stadia as required.

Thursday, February 21, 2019

It’s Spelt “Rouge:” Expected Points in U Sports

1. Abstract

For an existing database of U Sports play-by-play data five different models were created to look at Expected Points in U Sports football. The results of these models are presented, in addition to the results of the raw data, allowing the models to be compared to the raw data and against one another. Furthermore, extensive correlation graphs are presented to allow models to be assessed based on their effectiveness in predicting EP. The multi-layer perceptron model proves itself to be the most effective across all scenarios, followed by the gradient boosting and k-nearest neighbours models. The random forest and logistic regression models proved poor estimators of EP and are contraindicated for future use.

Tuesday, February 12, 2019

Appendix 2 to New Year, New Data: Additions to the Passes and Patterns Database

9. Appendix 2: List of CFL Games

The table here gives a list of all the games added to the CFL database from the 2018 season.

Saturday, February 9, 2019

Appendix 1 to New Year, New Data: Additions to the Passes and Patterns Database


8. Appendix 1: List of U Sports Games


The table here gives a list of all the games added to the U Sports database from the 2018 season.

Thursday, January 24, 2019

New Year, New Data: Additions to the Passes and Patterns Knowledge Base

1. Abstract

    An update on the developments affecting the various articles previously published in this space, covering both the analyses of other work and original research. Datasets for original research have been updated with 2018 data for both the CFL and U Sports. Previously written state of the art pieces that have seen new work in the field include a postscript to the original work to fold in the new research. Finally, original research previously done has been updated with the new data brought in.
    The critical developments covered here include an American P(1D) (Pelechrinis and Papalexakis 2016b) model that shows non-linearity for 3rd down in a manner similar to that previously found in Canadian football (Clement 2018e, [g] 2018), and the development of a WP model for Canadian football (Thiel 2019).

    Monday, January 7, 2019

    Given the Boot: The Analytics of Kickoffs

    1. Abstract

    The third piece in a series on the current state of affairs regarding analytical research into football’s kicking plays, this piece looks at kickoffs. The broad conclusions to draw from the corpus are that the rule changes regarding touchbacks have had a major impact in reducing the number of kickoff returns and negatively impacting the starting field position after a kickoff; and that onside kicks are underutilized. Their success rate is almost entirely dependent on whether or not the kicking team is obliged by game situation to attempt an onside kick, and non-necessary onside kicks have a far higher success rate, high enough that their use is currently an under-exploited area of opportunity.

    Monday, December 17, 2018

    Three Point Plays: The Analytics of Field Goals

    1. Abstract

    A look at the development of models determining field goal probability, and related studies of meaningful predictor variables. Logistic regression is the most common way of incorporating different predictor values, with a single example of a neural network. Distance is unfailingly the strongest predictor of success, and by an order of magnitude over any other variable. Useful environmental variables also include wind, rain, and altitude. The question of clutch kicking is discussed ad nauseum, with a general consensus of there being little effect if any, and icing the kicker similarly finds little support in most works, in some cases even contraindicated.

    Thursday, October 18, 2018

    Kick it Away, Kick it Away, Kick it Away Now: The Analytics of Punting


      1. Abstract


      A study of the development of research on punting in football. Punting is shown to have improved steadily over time, by both measures of yardage and more sophisticated measures such as Expected Points (EP). The existing official statistics are criticized and being result-oriented without regard to the process or factors beyond the punter’s control. Better measures are suggested and a method of assessing punts relative to their expectation based on a large number of environmental and circumstantial factors to rate punters independently of their opportunities.

      Saturday, October 13, 2018

      The Roman Numerals of Computing: An Object-Oriented Database of U Sports Football

      1. Abstract

      A redevelopment of the U Sports parser and calculator previously described (Clement 2018b) that was built using VBA, this time working in Python. Data is imported through Python’s csv package, and parsed using an object-oriented approach, creating games and plays as classes with attributes as appropriate to each. Further objects exist to support analysis on the parsed data, and the numpy package with its arrays allows for far faster calculation of results. Discussion of future work built on this restructured database includes examination of special teams, expected points (EP) and Win Probability (WP).

      Monday, September 17, 2018

      The Whole Ten Yards: P(1D) in the CFL

      1-Abstract

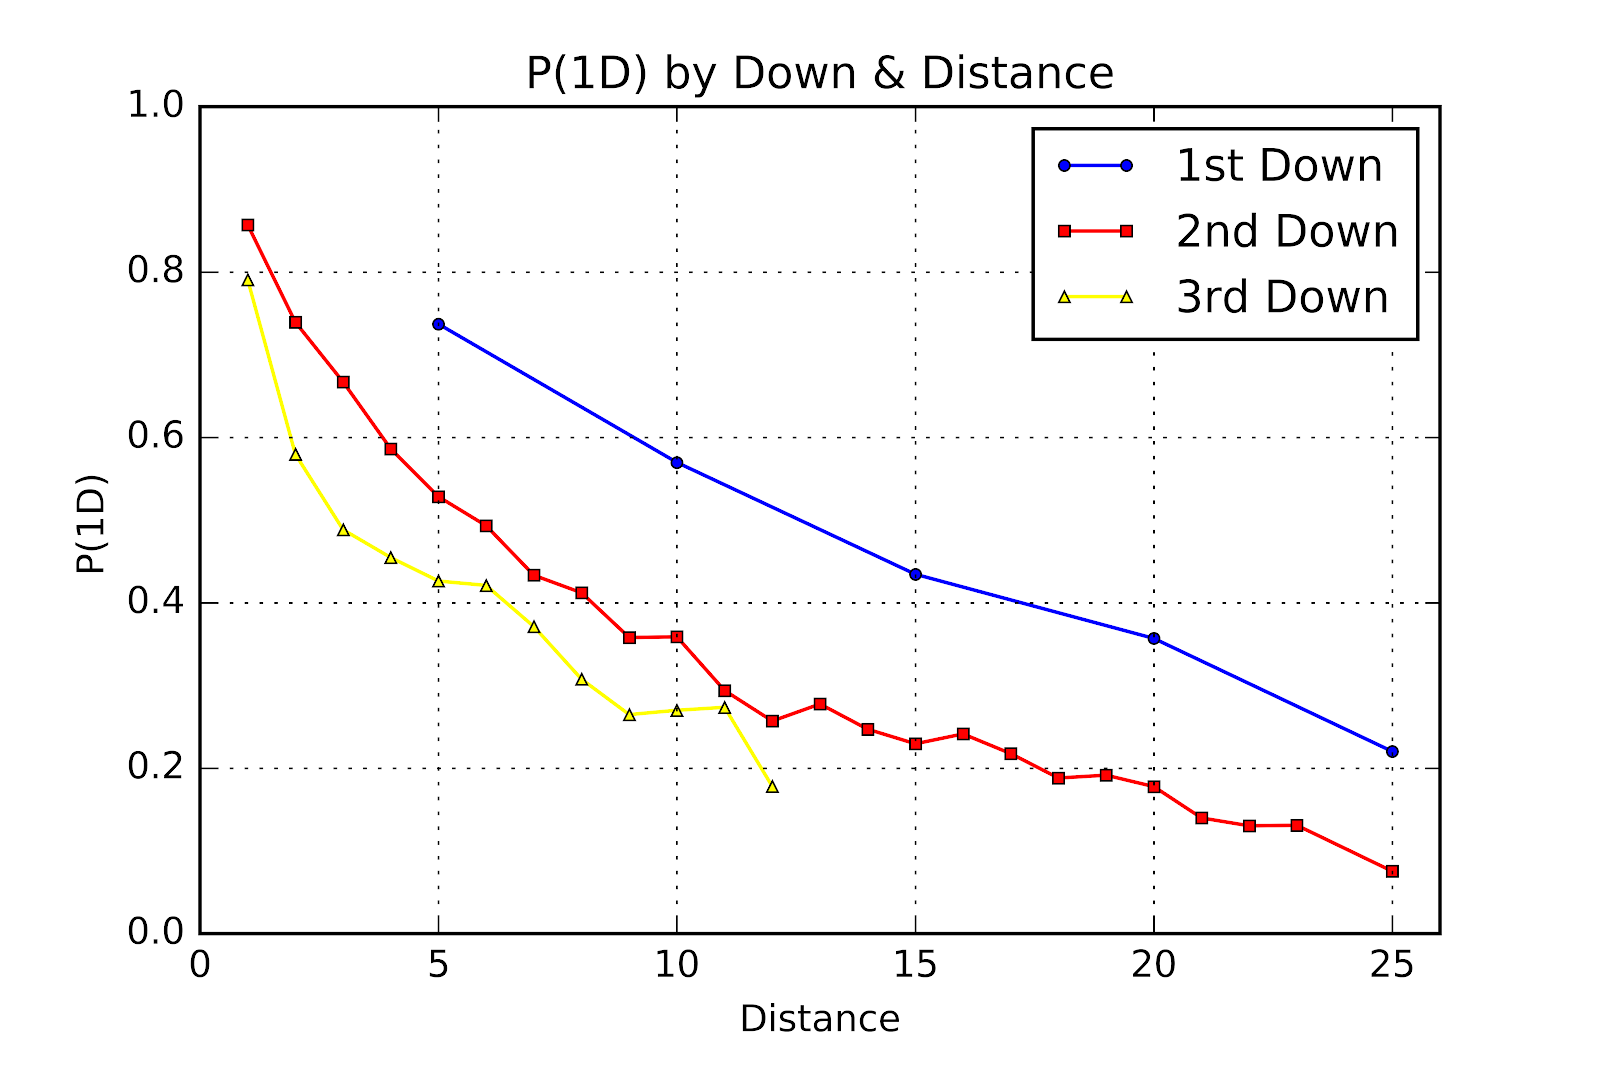
      P(1D) values across down and distance were calculated for CFL data across down & distance. & Goal situations were separated and viewed independently. Results were compared to results obtained using the same methods on U Sports data. CFL offenses generally follow the same trends as seen in U Sports in terms of P(1D), though CFL P(1D) is consistently ~5 percentage points higher than U Sports under the same conditions. 1st down follows the same linear trend, while 2nd down shows exponential decay, with the previously discussed “Stupidity Asymptote” at 10%. However, CFL teams are markedly less willing to attempt 3rd down conversions, causing a lack of usable data points for 3rd down. For & goal situations the disparity between CFL and U Sports P(1D) does not seem to be as prevalent.

      Friday, August 31, 2018

      Appendix to Going Pro: Developing a CFL Play-by-Play Database

      6-Appendix 1: List of Games

      The table below provides a complete list of all the games for which play-by-play data has been found and included in the database as of the date of publication. The games are listed chronologically by date played, oldest game first.

      Thursday, August 30, 2018

      Going Pro: Developing a CFL Play-by-Play Database

      1-Abstract

      CFL play-by-play data was collected from the official website into a single database. Idiosyncrasies in the structure of the data required the development of a VBA HTML scraper into a database. The data was parsed with a method that parallels the U Sports database, making it available for future investigation.

      Three Downs Away: P(1D) In U Sports Football

      1-Abstract A data set of U Sports football play-by-play data was analyzed to determine the First Down Probability (P(1D)) of down & d...